
Weekly Power 3
Did you know there is a simple line you can place on your chart to immediately make the weeks price action more understandable? It’s called the Weekly Open Line. And it’s the opening price of the trading week. It was created by The Inner Circle Trader (ICT) and incorporates another one of his concepts called Power 3.
This TradingView indicator was inspired by a YouTube video ICT Forex - The Weekly Bias - Excellence In Short Term Trading by The Inner Circle Trader.
In this video, ICT gives his swing trading model. Did you even know ICT had a swing trading model? Yep, and it’s awesome!
The Weekly Power 3 indicator takes the idea of the Weekly Open Line and builds a suite of intelligent and dynamic tools around it that will immediately help the user to start understanding how price moves within the trading week context.
Features
- Static Weekly Open Line
- Intelligent Days of the Week Text
- Dynamic Weekly High Line
- Dynamic Weekly Low Line
- Weekly High Candle Label (highest candle of the week)
- Weekly Low Candle Label (lowest candle of the week)
- Best Odds High of the Week Zone Line & Text
- Best Odds Low of the Week Zone Line & Text
Components
The primary feature is a line that forms on the weekly open price and grows as the week progresses. Additionally, lines are created for the highest and lowest prices of the week so the weekly profile can be easily recognized. A dynamic label marks each weeks highest and lowest point. This will automatically move as prices expand throughout the week.
A very useful component of the Weekly Power 3 indicator is the Days of the Week text. Each Day of the Week text is displayed in the middle of each trading day and also the user can specify in the Settings whether to position the text at the high or low of the weeks price range. Additionally, there is a Buffer setting that allows the user to move the Days of the Week text up or down to prevent chart overlapping.
To help the user visualize the span of time with the best odds of forming the weekly highs or weekly lows, according to ICT, this indicator adds at static line and optional label into the charts future that projects the span from Tuesday’s London Open to Wednesday’s New York. Having a static line out in the future on your chart really helps to picture where price could be drawn to based solely around time of the week.
Premise
ICT says that the weekly open price is the most important level that price reacts to across the five days of a trading week. If the week profile is expected to be bullish then price many times goes below the weekly open line at the beginning of the week and above it later in the week (a.k.a. Bullish Power 3). Consequently, if the week is anticipated to be a bearish week, price often times starts the week high and then goes lower throughout the week (a.k.a. Bearish Power 3).
ICT always specifies that the weekly high or weekly low have the best odds of forming between the Tuesday’s London Open and Wednesday’s New York Open.
Inputs and Style
Like all scripts publish by Infinity Trading, everything in the indicator is customizable by the user. Every label, line, or text can be individually toggled ON or OFF so the user has complete control over the elements they want displayed on their chart. All the lines can be individually adjusted by color, line style, or line width. The color and text color on the high and low of the week labels can be individually changed. The text in the chart (day of the week & best odds zones text) each have a “buffer” value. This allows the user to individually move the text up or down on the chart to declutter the chart. And lastly, the day of the week text can be positioned above or below the weeks price action and the text will dynamically move higher or lower as price expands throughout the week.
Screenshots
View the weeks price action
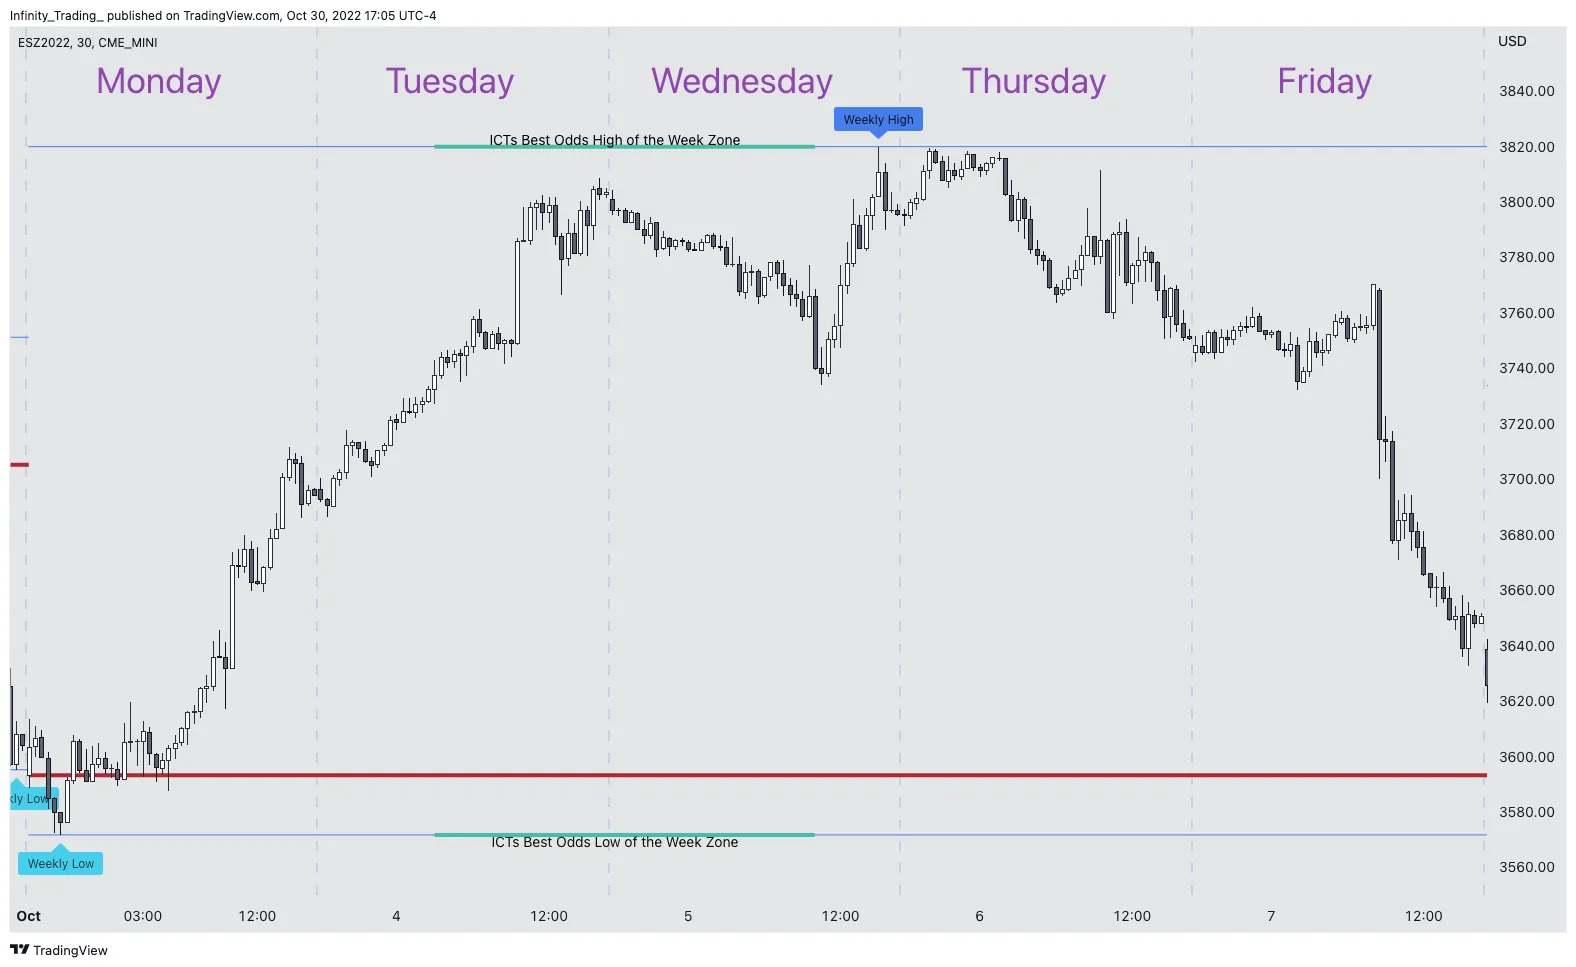
Weekly Power 3 TradingView Indicator Image 1
View multiple weeks price action
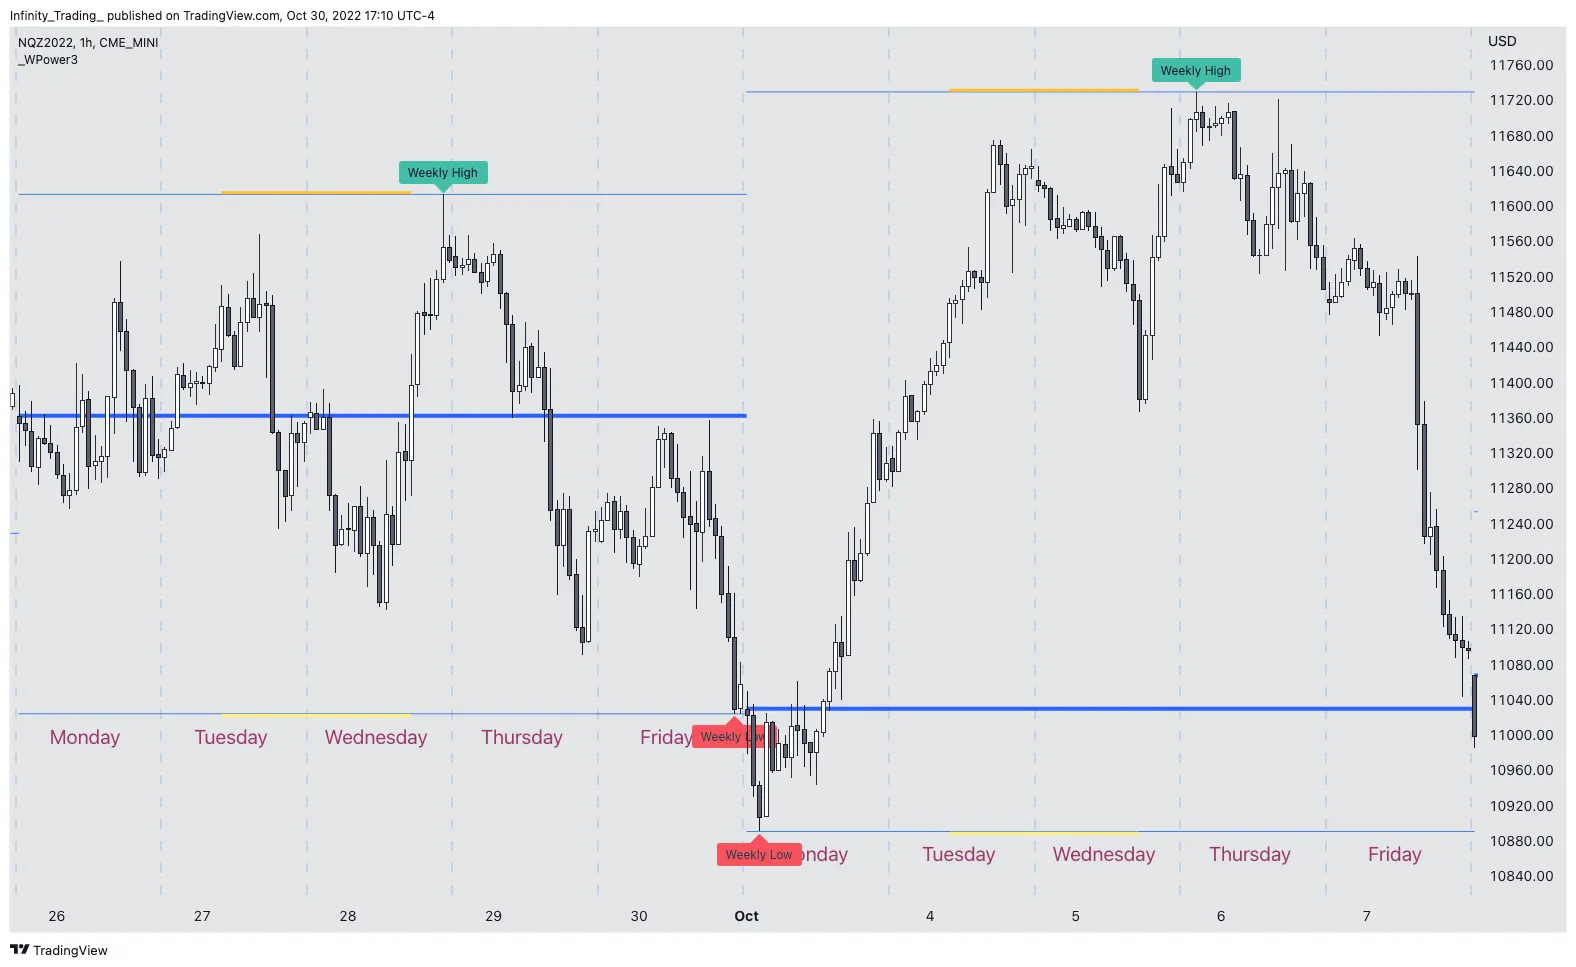
Weekly Power 3 TradingView Indicator Image 2
Visualize future price action
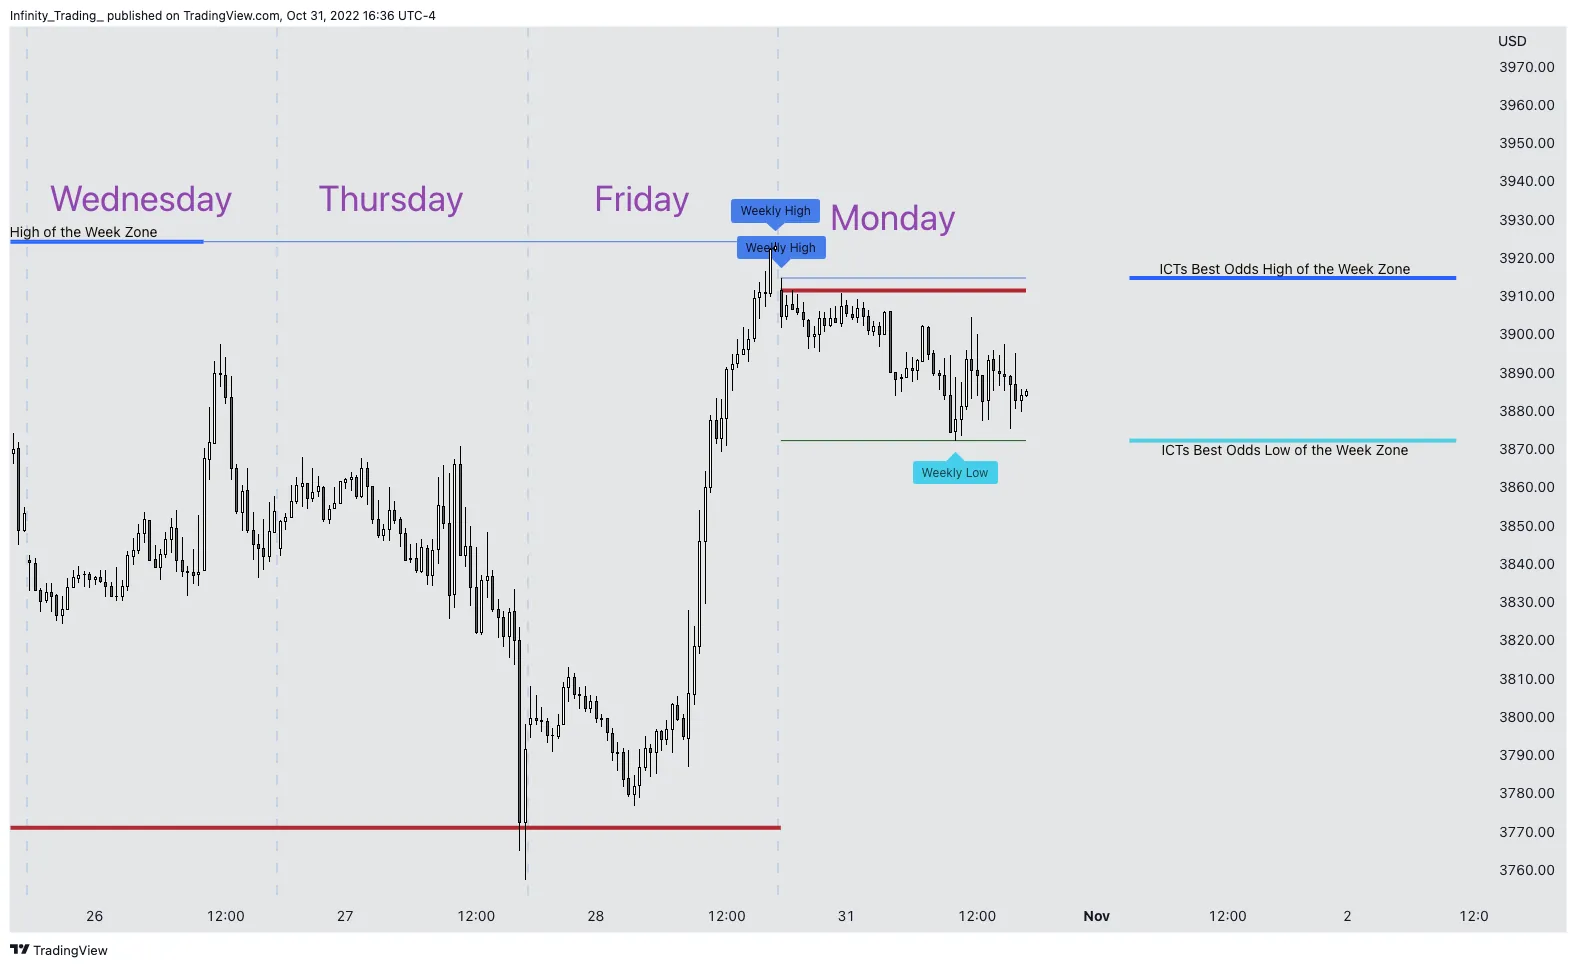
Weekly Power 3 TradingView Indicator Image 3
Code
// © Infinity_Trading_
// Last Modified: 11/1/2022

//@version=5
indicator(title="Weekly Power 3", shorttitle="_WPower3", overlay=true, max_lines_count=100)

// Purpose:
//
// Did you know there is a simple line you can place on your chart to immediately make the weeks price action more understandable?
// Its called the Weekly Open Line. And its the opening price of the trading week.
// It was created by The Inner Circle Trader (ICT) and incorporates another one of his concepts called Power 3.

// Usage:
//
// Like all scripts publish by Infinity Trading, everything in the indicator is customizable by the user.
// Every label, line, or text can be individually toggled ON or OFF so the user has complete control over the element they want displayed on their chart.
// All of the lines can be individually adjusted by color, line style, or line width.
// The color and text color on the high and low of the week labels can be individually changed.
// And so much more!


///////////////////////////////////////////////////////////////////////////////// INPUTS

var string GP1 = "Weekly Open Line"
i_weekly_open_toggle = input.bool(defval=true, title="Color", group=GP1, inline="weekly_open")
i_weekly_open_color = input.color(defval=color.new(#b22833, 0), title="", group=GP1, inline="weekly_open")
i_weekly_open_width = input.int(defval=4, minval=1, maxval=10, title="Line Width", group=GP1)
i_weekly_open_line_style = input.string(defval="solid (─)", title="Line Style", options=["solid (─)", "dotted (┈)", "dashed (╌)"], group=GP1)


var string GP2 = "Weekly High"
// Weekly high line
i_weekly_high_toggle = input.bool(defval=true, title="High Line", group=GP2, inline="weekly_high")
i_weekly_high_color = input.color(defval=color.new(#0e2ddc, 0), title="", group=GP2, inline="weekly_high")
i_weekly_high_width = input.int(defval=1, minval=1, maxval=10, title="", group=GP2, inline="weekly_high")
i_weekly_high_line_style = input.string(defval="solid (─)", title="", options=["solid (─)", "dotted (┈)", "dashed (╌)"], group=GP2, inline="weekly_high")
// Weekly high label
i_weekly_high_label_toggle = input.bool(defval=true, title="High Label", group=GP2, inline="weekly_high_label")
i_weekly_high_label_color = input.color(defval=color.new(#42bda8, 0), title="", group=GP2, inline="weekly_high_label")
i_weekly_high_label_textcolor = input.color(defval=color.new(#131722, 0), title="", group=GP2, inline="weekly_high_label")
i_weekly_high_label_size = input.string(defval="Normal", title="Size", options=["Tiny", "Small", "Normal", "Large", "Huge", "Auto"], group=GP2, inline="weekly_high_label")

var string GP3 = "Weekly Low"
// Weekly low line
i_weekly_low_toggle = input.bool(defval=true, title="Low Line", group=GP3, inline="weekly_low")
i_weekly_low_color = input.color(defval=color.new(#0e2ddc, 0), title="", group=GP3, inline="weekly_low")
i_weekly_low_width = input.int(defval=1, minval=1, maxval=10, title="", group=GP3, inline="weekly_low")
i_weekly_low_line_style = input.string(defval="solid (─)", title="", options=["solid (─)", "dotted (┈)", "dashed (╌)"], group=GP3, inline="weekly_low")
// Weekly low label
i_weekly_low_label_toggle = input.bool(defval=true, title="Low Label", group=GP3, inline="weekly_low_label")
i_weekly_low_label_color = input.color(defval=color.new(#f7525f, 0), title="", group=GP3, inline="weekly_low_label")
i_weekly_low_label_textcolor = input.color(defval=color.new(#131722, 0), title="", group=GP3, inline="weekly_low_label")
i_weekly_low_label_size = input.string(defval="Normal", title="Size", options=["Tiny", "Small", "Normal", "Large", "Huge", "Auto"], group=GP3, inline="weekly_low_label")


var string GP5 = "Day of the Week Labels"
i_day_label_toggle = input.bool(defval=true, title="Display Labels", group=GP5)
i_day_text_color = input.color(defval=color.new(#7b1fa2, 20), title="Color", group=GP5, inline="day_text")
i_day_text_size = input.string(defval="Large", title="Size", options=["Tiny", "Small", "Normal", "Large", "Huge", "Auto"], group=GP5, inline="day_text")
i_day_label_buffer = input.int(defval=10, step=5, title="Buffer", minval=5, maxval=50, group=GP5)
i_day_label_position = input.string(defval="Above", title="Position", options=["Above", "Below"], group=GP5)

var string GP7 = "Best Odds High of the Week Zone (if Bearish Week)"

i_best_probability_high_toggle = input.bool(defval=true, title="High Zone Line", group=GP7, inline="best_prob_high", tooltip = "ICT says if you expect to have a Bullish Week the best odds are that the WEEKLY LOW will form between Tuesdays London Open and Wednesdays NY Open")
i_best_probability_high_color = input.color(defval=color.new(#90bff9, 0), title="", group=GP7, inline="best_prob_high")
i_best_probability_high_width = input.int(defval=4, minval=1, maxval=10, title="Width", group=GP7, inline="best_prob_high")
i_best_probability_high_text_toggle = input.bool(defval=false, title="Display Label ", group=GP7, inline="best_prob_high2")
i_best_probability_high_text_color = input.color(defval=color.new(#131722, 0), title="", group=GP7, inline="best_prob_high2")
i_best_probability_high_buffer = input.int(defval=0, step=1, title="Buffer", minval=-5, maxval=5, group=GP7, inline="best_prob_high2")

var string GP6 = "Best Odds Low of the Week Zone (if Bullish Week)"

i_best_probability_low_toggle = input.bool(defval=true, title="Low Zone Line", group=GP6, inline="best_prob_low", tooltip = "ICT says if you expect to have a Bearish Week the best odds are that the WEEKLY HIGH will form between Tuesdays London Open and Wednesdays NY Open")
i_best_probability_low_color = input.color(defval=color.new(#90bff9, 0), title="", group=GP6, inline="best_prob_low")
i_best_probability_low_width = input.int(defval=4, minval=1, maxval=10, title="Width", group=GP6, inline="best_prob_low")
i_best_probability_low_text_toggle = input.bool(defval=false, title="Display Label ", group=GP6, inline="best_prob_low2")
i_best_probability_low_text_color = input.color(defval=color.new(#131722, 0), title="", group=GP6, inline="best_prob_low2")
i_best_probability_low_buffer = input.int(defval=0, step=1, title="Buffer", minval=-5, maxval=5, group=GP6, inline="best_prob_low2")


///////////////////////////////////////////////////////////////////////////////// HELPER FUNCTIONS


// Function the converts string inputs to line style code
line_style_function(input_var) =>
    switch input_var
        "dotted (┈)" => line.style_dotted
        "dashed (╌)" => line.style_dashed
        => line.style_solid


// Function that converts string inputs to text size code
text_size_function(string_size) =>
    switch string_size
        "Tiny" => size.tiny
        "Small" => size.small
        "Normal" => size.normal
        "Large" => size.large
        "Huge" => size.huge
        "Auto" => size.auto


weekly_open = request.security(syminfo.tickerid, "W", open)
weekly_past_low = request.security(syminfo.tickerid, "W", low)
weekly_past_high = request.security(syminfo.tickerid, "W", high)
weekly_time_open = request.security(syminfo.tickerid, "W", time)
weekly_time_close = request.security(syminfo.tickerid, "W", time_close)

///////////////////////////////////////////////////////////////////////////////// TIME

// Time of one period on your current chart
dt = time - time[1]
periods_in_24hrs = 1440 / timeframe.multiplier
// 31 hours between Tuesday London Open and Wed NY Open
// 1860 min in 31 hours
periods_in_high_prob_zone = 1860 / timeframe.multiplier
timespan_high_prob_zone = periods_in_high_prob_zone + periods_in_24hrs


tuesday_london_open_est = time(timeframe.period, '0300-0330:2', "America/New_York")
wednesday_ny_open_est = time(timeframe.period, '0930-1000:3', "America/New_York")

time_middle_hour = (hour(time, "America/New_York") == 4) and (minute(time) == 0)
timespan_week_est = time(timeframe.period, '1800-1559:123456', "America/New_York")


/////////////////////////////////////////////////////////////////////////////////


// Converts inputs selections into code
weekly_open_line_style = line_style_function(i_weekly_open_line_style)
weekly_high_line_style = line_style_function(i_weekly_high_line_style)
weekly_low_line_style = line_style_function(i_weekly_low_line_style)
weekly_high_label_size = text_size_function(i_weekly_high_label_size)
weekly_low_label_size = text_size_function(i_weekly_low_label_size)
day_text_size = text_size_function(i_day_text_size)


// Instantiate variables
var line line_weekly_open = na
var line line_weekly_high = na
var line line_weekly_low = na
var line line_weekly_low_best_prob = na
var line line_weekly_high_best_prob = na
var box box_monday = na
var box box_tuesday = na
var box box_wednesday = na
var box box_thursday = na
var box box_friday = na
var box box_best_prob_low = na
var box box_best_prob_high = na
var float weekly_high = 0.0
var float weekly_low = 0.0
var float label_level = 0.0
var float first_weekly_candle_low = 0.0
var float first_weekly_candle_high = 0.0
var label label_weekly_high = na
var label label_weekly_low = na


///////////////////////////////////////////////////////////////////////////////// MAIN LOGIC
///////////////////////////////////////////////////////////////////////////////// Determines whether current candle is the start of new week


// Start of new week
if dayofmonth(time, "America/New_York") != dayofmonth(time, "America/New_York")[1] and dayofweek(time, "America/New_York") == dayofweek.sunday

    if i_weekly_open_toggle
        // Draw Weekliy Open Line for all previous weeks
        line_weekly_open := line.new(x1=weekly_time_open, y1=weekly_open, x2=weekly_time_close, y2=weekly_open, xloc=xloc.bar_time, color=i_weekly_open_color, style=weekly_open_line_style, width=i_weekly_open_width)


    if i_weekly_high_toggle
        line_weekly_high := line.new(x1=weekly_time_open, y1=weekly_past_high, x2=weekly_time_close, y2=weekly_past_high, xloc=xloc.bar_time, color=i_weekly_high_color, style=weekly_high_line_style, width=i_weekly_high_width)


    if i_weekly_low_toggle
        line_weekly_low := line.new(x1=weekly_time_open, y1=weekly_past_low, x2=weekly_time_close, y2=weekly_past_low, xloc=xloc.bar_time, color=i_weekly_low_color, style=weekly_low_line_style, width=i_weekly_low_width)


    // Reset weeky variables
    weekly_high := 0.0
    weekly_low := 50000.0

    // Create blank box at the start of each week
    box_monday := box.new(left=na, top=na, right=na, bottom=na, xloc=xloc.bar_index, text="Monday", text_color=i_day_text_color, text_halign=text.align_center, text_valign=text.align_center, text_size=day_text_size, border_color=color.new(#000000, 100), border_width=2, border_style=line.style_solid, bgcolor=color.new(#000000, 100))
    box_tuesday := box.new(left=na, top=na, right=na, bottom=na, xloc=xloc.bar_index, text="Tuesday", text_color=i_day_text_color, text_halign=text.align_center, text_valign=text.align_center, text_size=day_text_size, border_color=color.new(#000000, 100), border_width=2, border_style=line.style_solid, bgcolor=color.new(#000000, 100))
    box_wednesday := box.new(left=na, top=na, right=na, bottom=na, xloc=xloc.bar_index, text="Wednesday", text_color=i_day_text_color, text_halign=text.align_center, text_valign=text.align_center, text_size=day_text_size, border_color=color.new(#000000, 100), border_width=2, border_style=line.style_solid, bgcolor=color.new(#000000, 100))
    box_thursday := box.new(left=na, top=na, right=na, bottom=na, xloc=xloc.bar_index, text="Thursday", text_color=i_day_text_color, text_halign=text.align_center, text_valign=text.align_center, text_size=day_text_size, border_color=color.new(#000000, 100), border_width=2, border_style=line.style_solid, bgcolor=color.new(#000000, 100))
    box_friday := box.new(left=na, top=na, right=na, bottom=na, xloc=xloc.bar_index, text="Friday", text_color=i_day_text_color, text_halign=text.align_center, text_valign=text.align_center, text_size=day_text_size, border_color=color.new(#000000, 100), border_width=2, border_style=line.style_solid, bgcolor=color.new(#000000, 100))


    // Weekly High Label on opening candle of the week
    if i_weekly_high_label_toggle
        // Add a label for the high of the current week
        label_weekly_high := label.new(x=bar_index, y=high + 3, xloc=xloc.bar_index, yloc=yloc.price, text="Weekly High", color=i_weekly_high_label_color, style=label.style_label_down, textcolor=i_weekly_high_label_textcolor, size=weekly_high_label_size)

    // Weekly Low Label on opening candle of the week
    if i_weekly_low_label_toggle
        // Add a label for the low of the current week
        label_weekly_low := label.new(x=bar_index, y=low - 3, xloc=xloc.bar_index, yloc=yloc.price, text="Weekly Low", color=i_weekly_low_label_color, style=label.style_label_up, textcolor=i_weekly_low_label_textcolor, size=weekly_low_label_size)

    // Variable to keep track of high/low when opening candle is high/low of the week
    first_weekly_candle_high := high
    first_weekly_candle_low := low


    // Restart variable for Best Probability Weekly High/Low Zones
    line_weekly_low_best_prob := line.new(x1=na, y1=na, x2=na, y2=na, color=color.yellow, style=line.style_solid, width=4)
    box_best_prob_low := box.new(left=na, top=na, right=na, bottom=na, xloc=xloc.bar_index, text="ICTs Best Odds Low of the Week Zone", text_color=i_best_probability_low_text_color, text_halign=text.align_center, text_valign=text.align_center, text_size=size.normal, border_color=color.new(#000000, 100), border_width=2, border_style=line.style_solid, bgcolor=color.new(#000000, 100))
    line_weekly_high_best_prob := line.new(x1=na, y1=na, x2=na, y2=na, color=color.yellow, style=line.style_solid, width=4)
    box_best_prob_high := box.new(left=na, top=na, right=na, bottom=na, xloc=xloc.bar_index, text="ICTs Best Odds High of the Week Zone", text_color=i_best_probability_high_text_color, text_halign=text.align_center, text_valign=text.align_center, text_size=size.normal, border_color=color.new(#000000, 100), border_width=2, border_style=line.style_solid, bgcolor=color.new(#000000, 100))


else

    // Weekly High Label after the first candle of the week
    // For second candle of the week
    if weekly_high == 0.0
        if i_weekly_high_label_toggle and high > high[1]
            // Add a label for the high of the current week
            label_weekly_high := label.new(x=bar_index, y=high + 3, xloc=xloc.bar_index, yloc=yloc.price, text="Weekly High", color=i_weekly_high_label_color, style=label.style_label_down, textcolor=i_weekly_high_label_textcolor, size=weekly_high_label_size)
            label.delete(label_weekly_high[1])
    else
        // For all subsequent candles of the week
        if i_weekly_high_label_toggle and high > weekly_high and high > first_weekly_candle_high
            // Add a label for the high of the current week
            label_weekly_high := label.new(x=bar_index, y=high + 3, xloc=xloc.bar_index, yloc=yloc.price, text="Weekly High", color=i_weekly_high_label_color, style=label.style_label_down, textcolor=i_weekly_high_label_textcolor, size=weekly_high_label_size)
            label.delete(label_weekly_high[1])

    // Weekly Low Label after the first candle of the week
    // For second candle of the week
    if weekly_low == 50000.0
        if i_weekly_low_label_toggle and low < low[1]
            // Add a label for the low of the current week
            label_weekly_low := label.new(x=bar_index, y=low - 3, xloc=xloc.bar_index, yloc=yloc.price, text="Weekly Low", color=i_weekly_low_label_color, style=label.style_label_up, textcolor=i_weekly_low_label_textcolor, size=weekly_low_label_size)
            label.delete(label_weekly_low[1])

    else
        // For all subsequent candles of the week
        if i_weekly_low_label_toggle and low < weekly_low and low < first_weekly_candle_low
            // Add a label for the low of the current week
            label_weekly_low := label.new(x=bar_index, y=low - 3, xloc=xloc.bar_index, yloc=yloc.price, text="Weekly Low", color=i_weekly_low_label_color, style=label.style_label_up, textcolor=i_weekly_low_label_textcolor, size=weekly_low_label_size)
            label.delete(label_weekly_low[1])


    // Update variable only if current candle is a higher high or lower low
    weekly_high := math.max(weekly_high, high)
    weekly_low := math.min(weekly_low, low)

    // Are the labels to be displayed above or below the weekly price action?
    label_level := i_day_label_position == "Above" ? weekly_high + i_day_label_buffer : weekly_low - i_day_label_buffer

        // Settings input to turn Day of the Week boxes ON/OFF
    if i_day_label_toggle

        // On Monday at 3 AM EST create box
        if time_middle_hour and dayofweek(time, "America/New_York") == dayofweek.monday
            box.set_top(box_monday, label_level)
            box.set_bottom(box_monday, label_level - 1)

            box.set_left(box_monday, bar_index)
            box.set_right(box_monday, bar_index + 1)

        // On Tuesday at 3 AM EST create box
        if time_middle_hour and dayofweek(time, "America/New_York") == dayofweek.tuesday
            box.set_top(box_tuesday, label_level)
            box.set_bottom(box_tuesday, label_level - 1)

            box.set_left(box_tuesday, bar_index)
            box.set_right(box_tuesday, bar_index + 1)


        // On Wednesday at 3 AM EST create box
        if time_middle_hour and dayofweek(time, "America/New_York") == dayofweek.wednesday
            box.set_top(box_wednesday, label_level)
            box.set_bottom(box_wednesday, label_level - 1)

            box.set_left(box_wednesday, bar_index)
            box.set_right(box_wednesday, bar_index + 1)


        // On Thursday at 3 AM EST create box
        if time_middle_hour and dayofweek(time, "America/New_York") == dayofweek.thursday
            box.set_top(box_thursday, label_level)
            box.set_bottom(box_thursday, label_level - 1)

            box.set_left(box_thursday, bar_index)
            box.set_right(box_thursday, bar_index + 1)


        // On Friday at 3 AM EST create box
        if time_middle_hour and dayofweek(time, "America/New_York") == dayofweek.friday
            box.set_top(box_friday, label_level)
            box.set_bottom(box_friday, label_level - 1)

            box.set_left(box_friday, bar_index)
            box.set_right(box_friday, bar_index + 1)


        // At every new candle during week update highs and lows and redraw the box
        if timespan_week_est

            // Monday update
            box.set_top(box_monday, label_level)
            box.set_bottom(box_monday, label_level - 1)
            // Tuesday update
            box.set_top(box_tuesday, label_level)
            box.set_bottom(box_tuesday, label_level - 1)
            // Wednesday update
            box.set_top(box_wednesday, label_level)
            box.set_bottom(box_wednesday, label_level - 1)
            // Thursday update
            box.set_top(box_thursday, label_level)
            box.set_bottom(box_thursday, label_level - 1)
            // Friday update
            box.set_top(box_friday, label_level)
            box.set_bottom(box_friday, label_level - 1)

    ///////////////////////////////////////////////////////////////////////////////// BEST PROBABILITY HIGH/LOW ZONES

    // Toggle line for low zone of the week
    if i_best_probability_low_toggle
        // Create original line
        if timeframe.isminutes and time(timeframe.period, '0300-0301:2', "America/New_York") // Monday
            // Create line and shift over to start at Londons Open on Tuesday
            line_weekly_low_best_prob := line.new(x1=time + periods_in_24hrs * dt, y1=math.min(weekly_low, first_weekly_candle_low) + i_best_probability_low_buffer, x2=time + timespan_high_prob_zone * dt, y2=math.min(weekly_low, first_weekly_candle_low) + i_best_probability_low_buffer, xloc=xloc.bar_time, color=i_best_probability_low_color, style=line.style_solid, width=i_best_probability_low_width)
            // Toggle text on low zone of the week
            if i_best_probability_low_text_toggle
                box.set_top(box_best_prob_low, math.min(weekly_low, first_weekly_candle_low) + i_best_probability_low_buffer -2)
                box.set_bottom(box_best_prob_low, math.min(weekly_low, first_weekly_candle_low) + i_best_probability_low_buffer - 3)
                box.set_left(box_best_prob_low, bar_index + int(periods_in_high_prob_zone * 1.2))
                box.set_right(box_best_prob_low, bar_index + int(periods_in_high_prob_zone * 1.2) + 1)

        // Update y axis on line and box for each candle past London Open on Monday
        // Have to use min to take into account when weekly open == weekly low
        line.set_y1(line_weekly_low_best_prob, math.min(weekly_low, first_weekly_candle_low) + i_best_probability_low_buffer)
        line.set_y2(line_weekly_low_best_prob, math.min(weekly_low, first_weekly_candle_low) + i_best_probability_low_buffer)
        box.set_top(box_best_prob_low, math.min(weekly_low, first_weekly_candle_low) + i_best_probability_low_buffer -2)
        box.set_bottom(box_best_prob_low, math.min(weekly_low, first_weekly_candle_low) + i_best_probability_low_buffer - 3)


    if i_best_probability_high_toggle
        if timeframe.isminutes and time(timeframe.period, '0300-0301:2', "America/New_York") // Monday
            line_weekly_high_best_prob := line.new(x1=time + periods_in_24hrs * dt, y1=math.max(weekly_high, first_weekly_candle_high) + i_best_probability_high_buffer, x2=time + timespan_high_prob_zone * dt, y2=math.max(weekly_high, first_weekly_candle_high) + i_best_probability_high_buffer, xloc=xloc.bar_time, color=i_best_probability_high_color, style=line.style_solid, width=i_best_probability_high_width)
            if i_best_probability_high_text_toggle
                box.set_top(box_best_prob_high, math.max(weekly_high, first_weekly_candle_high) + i_best_probability_high_buffer + 3)
                box.set_bottom(box_best_prob_high, math.max(weekly_high, first_weekly_candle_high) + i_best_probability_high_buffer + 2)
                box.set_left(box_best_prob_high, bar_index + int(periods_in_high_prob_zone * 1.2))
                box.set_right(box_best_prob_high, bar_index + int(periods_in_high_prob_zone * 1.2) + 1)
        // Update y axis on line and box for each candle past London Open on Monday
        // Have to use min to take into account when weekly open == weekly low
        line.set_y1(line_weekly_high_best_prob, math.max(weekly_high, first_weekly_candle_high) + i_best_probability_high_buffer)
        line.set_y2(line_weekly_high_best_prob, math.max(weekly_high, first_weekly_candle_high) + i_best_probability_high_buffer)
        box.set_top(box_best_prob_high, math.max(weekly_high, first_weekly_candle_high) + i_best_probability_high_buffer + 3)
        box.set_bottom(box_best_prob_high, math.max(weekly_high, first_weekly_candle_high) + i_best_probability_high_buffer + 2)


///////////////////////////////////////////////////////////////////////////////// DRAW CURRENT WEEKS LINES


// Instantiate variables
var line line_curr_weekly_open = na
var line line_curr_weekly_high = na
var line line_curr_weekly_low = na

// Draw lines for current week for open, high, & low
if barstate.islast

    // Weekliy Open Line
    if i_weekly_open_toggle
        line_curr_weekly_open := line.new(x1=weekly_time_open, y1=weekly_open, x2=time, y2=weekly_open, xloc=xloc.bar_time, color=i_weekly_open_color, style=weekly_open_line_style, width=i_weekly_open_width)
        line.delete(line_curr_weekly_open[1])

    // Weekly High Line
    if i_weekly_high_toggle
        line_curr_weekly_high := line.new(x1=weekly_time_open, y1=weekly_past_high, x2=time, y2=weekly_past_high, xloc=xloc.bar_time, color=i_weekly_high_color, style=weekly_high_line_style, width=i_weekly_high_width)
        line.delete(line_curr_weekly_high[1])

    // Weekly Low Line
    if i_weekly_low_toggle
        line_curr_weekly_low := line.new(x1=weekly_time_open, y1=weekly_past_low, x2=time, y2=weekly_past_low, xloc=xloc.bar_time, color=i_weekly_low_color, style=weekly_low_line_style, width=i_weekly_low_width)
        line.delete(line_curr_weekly_low[1])