Elements Of A Trade Setup
Video 1/8
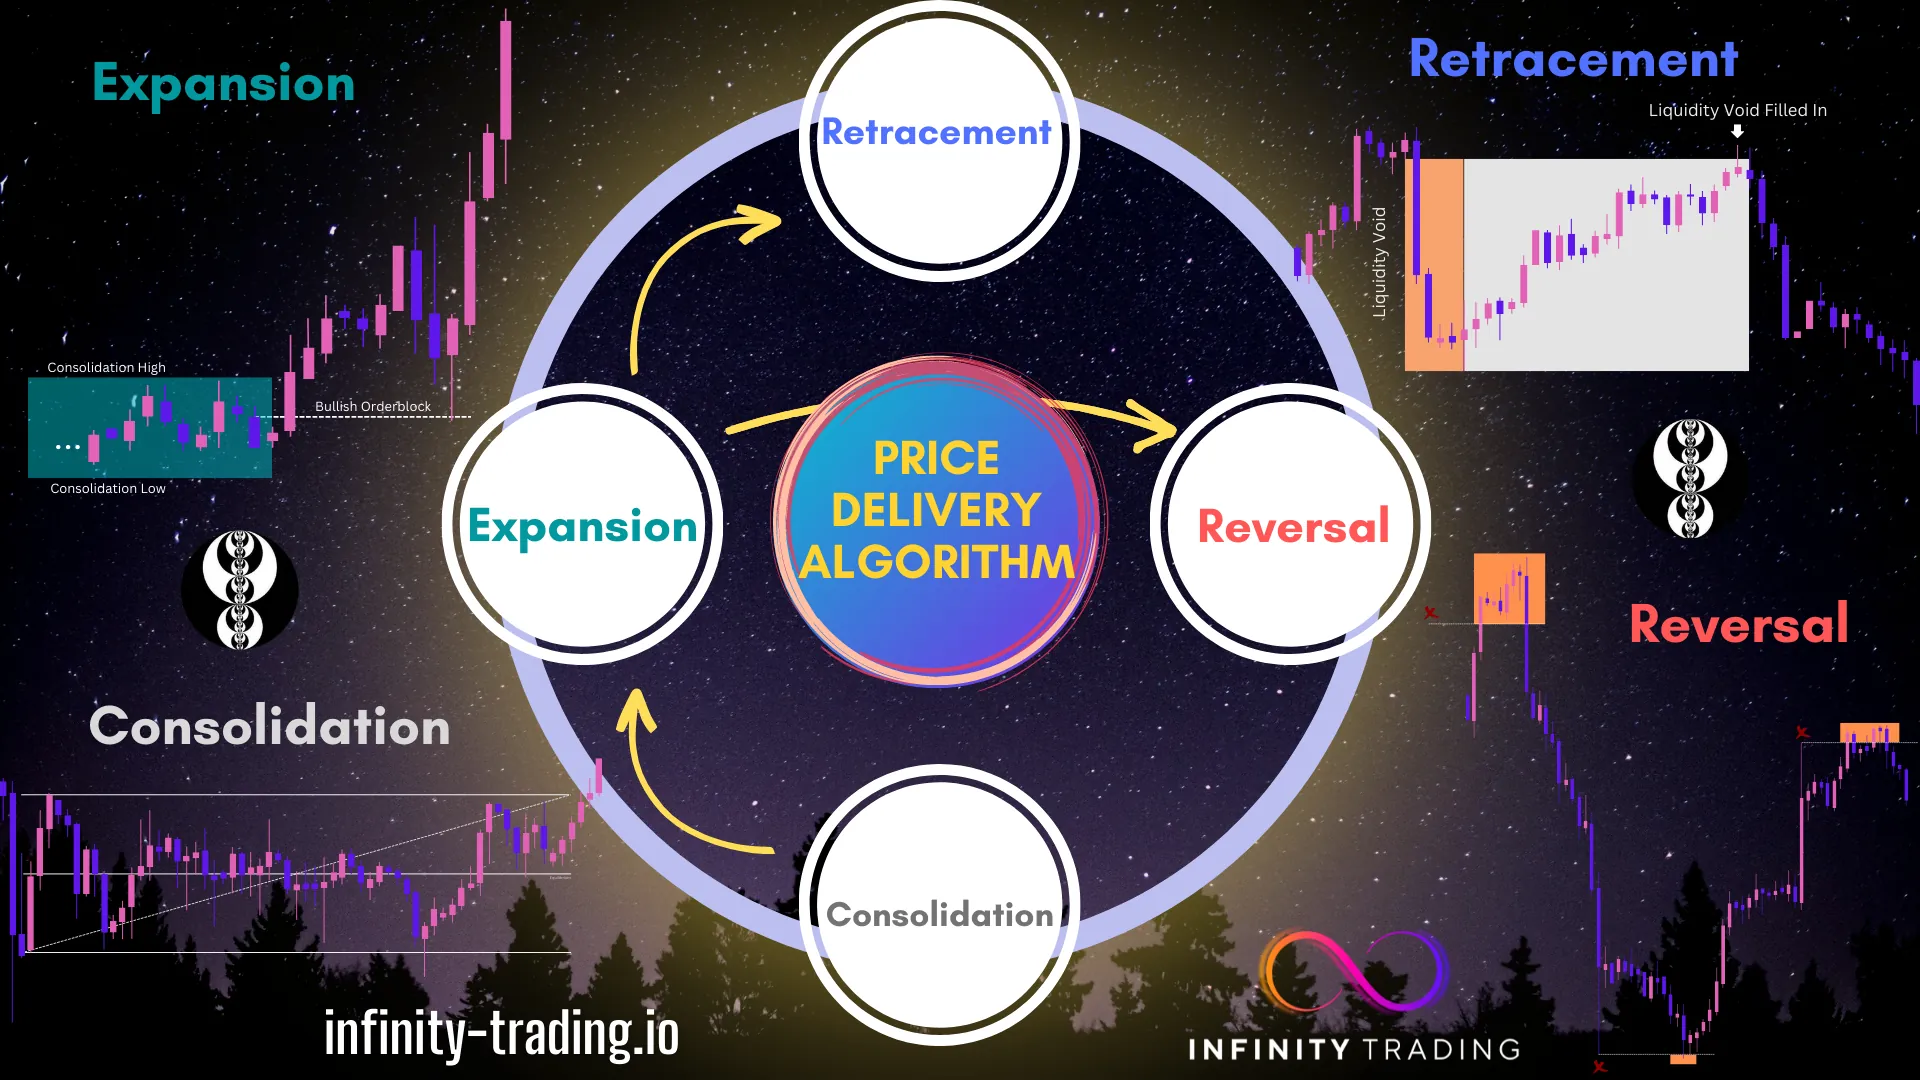
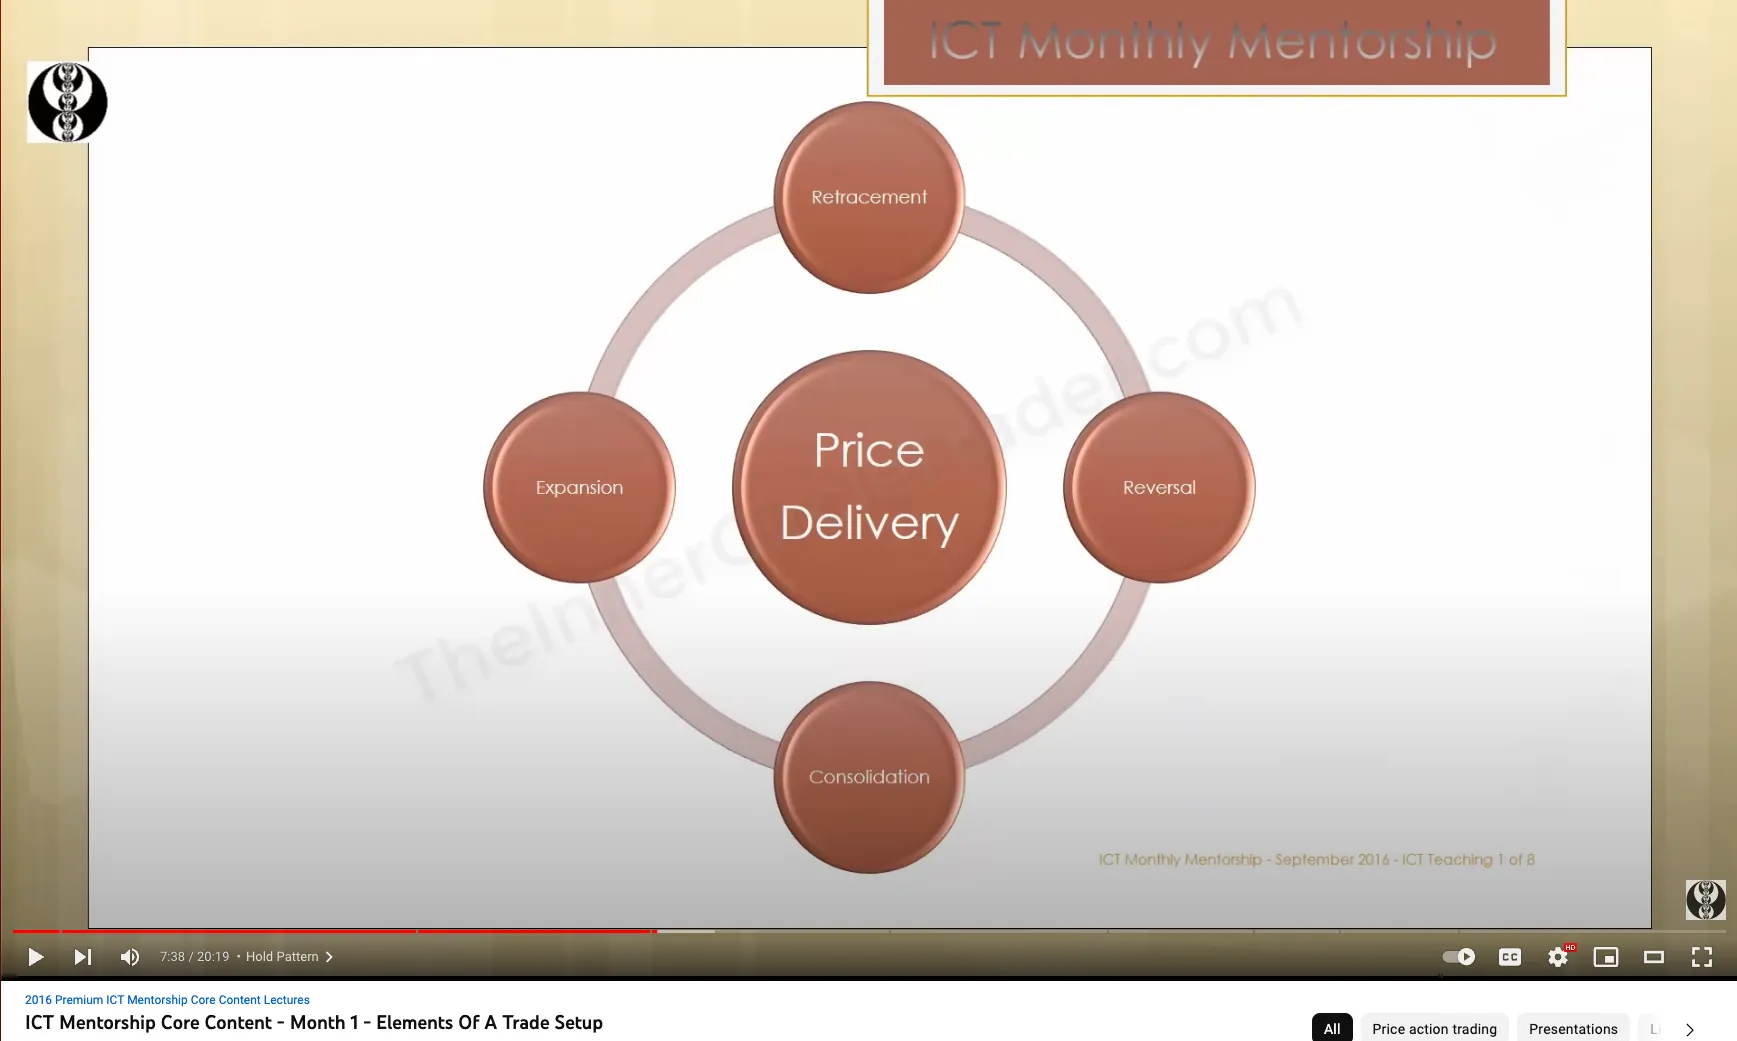
Price Delivering Phases
- Markets/Price can only do four things:
- Expansion
- Retracement
- Reversal
- Consolidation
- Price is always in either Consolidation, Expansion, Retracement, or Reversal
- All the moves start with Consolidation
- To effectively read price action identify the following elements:
- Equilibrium
- Orderblocks
- Fair Value Gaps & Liquidity Voids
- Liquidity Pools & Stop Runs
Price Delivery Phases
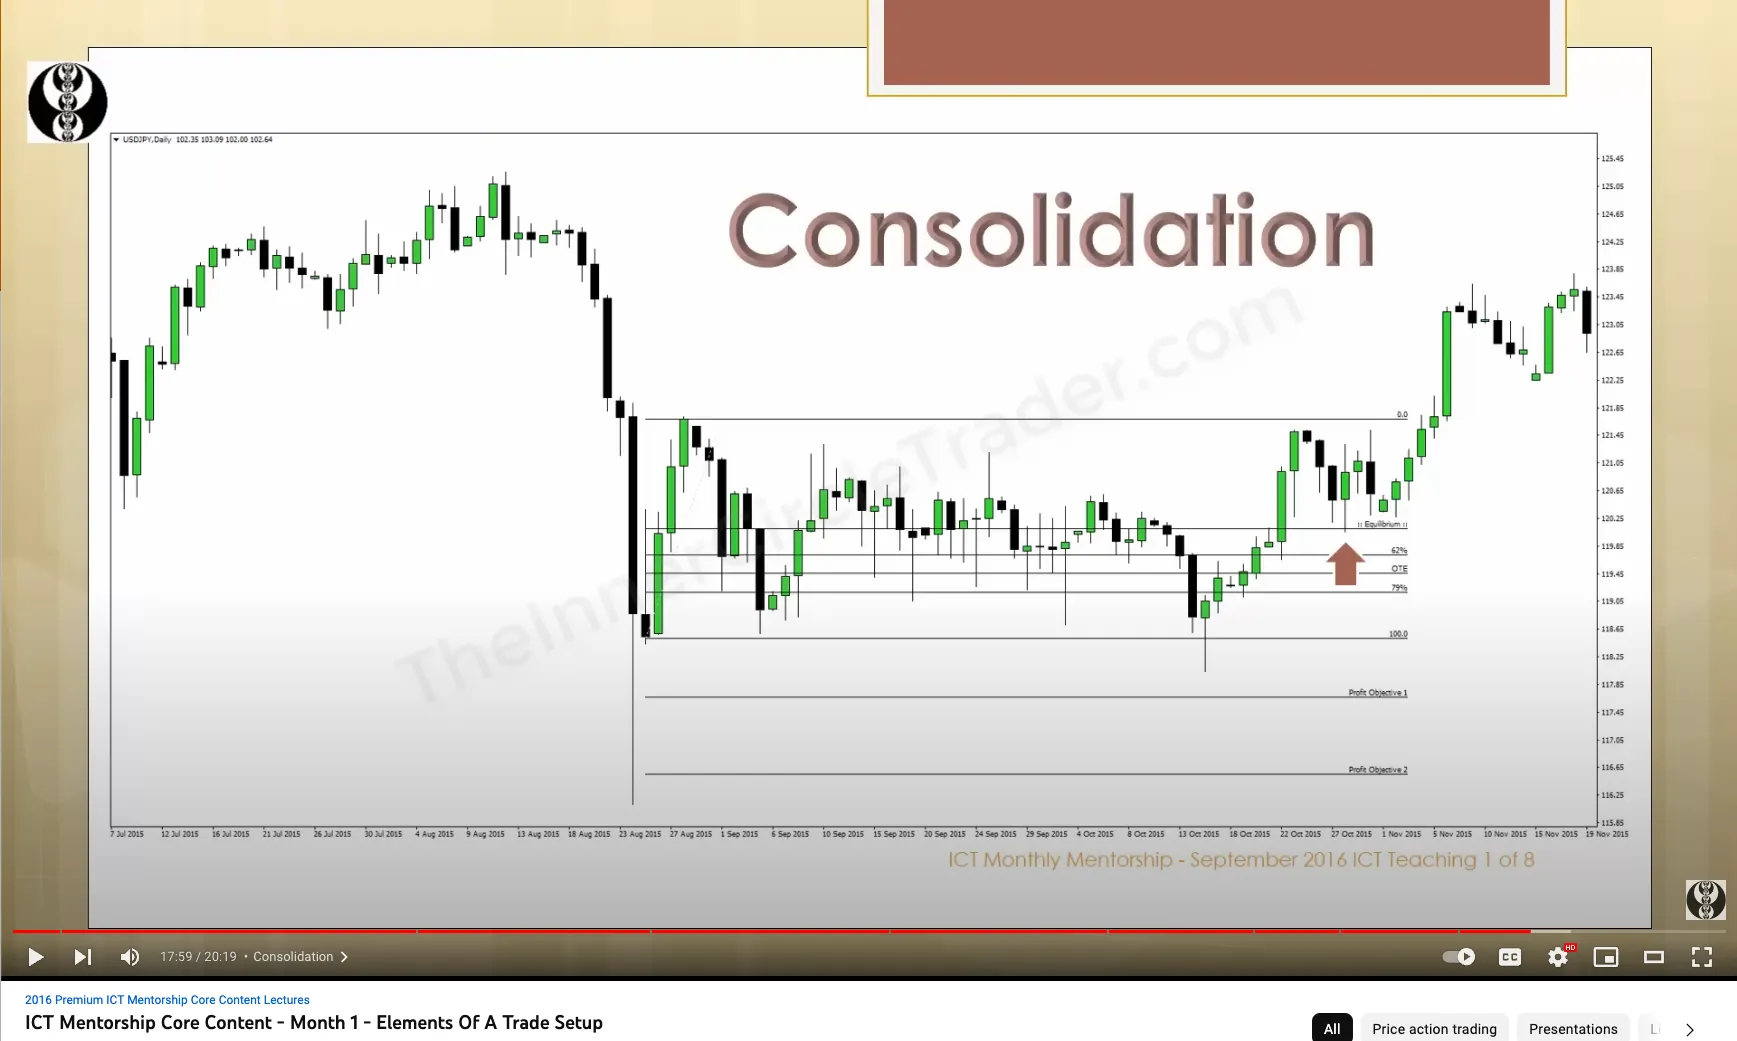
- Consolidation
- Consolidation occurs when price moves inside a clear trading range and shows no willingness to move significantly higher or lower
- Importance - When price consolidates it indicates the Market Makers are allowing orders to build on both sides of the market. Expect a new Expansion near term
- What do we look for in price? The impulse swing in price away from equilibrium price level (halfway point of the consolidation range)
Consolidation Phase
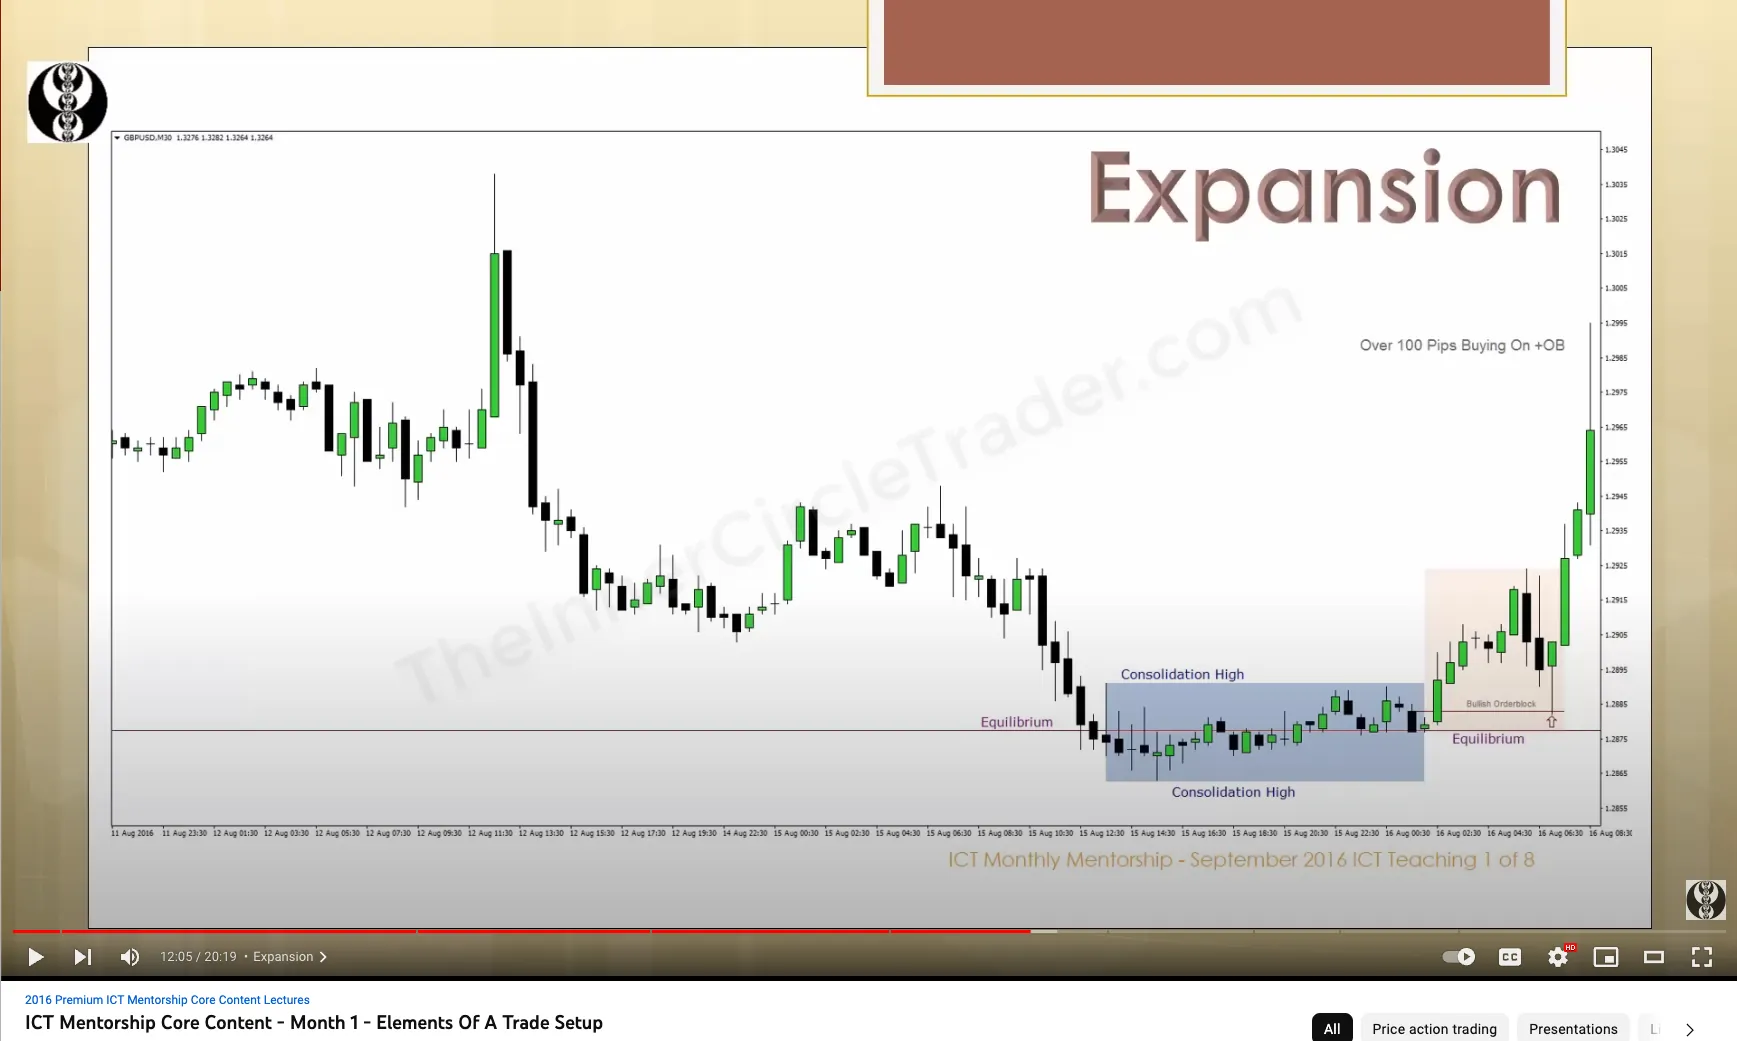
- Expansion
- Expansion occurs when price moves away quickly from an Equilibrium level inside a Consolidation
- Expansion and ICT Orderblocks go together
- Importance - When Expansion occurs, the direction of the Expansion indicates the Market Makers intended repricing model (i.e. what direction the market will continue going)
- What do we look for in price? The ICT Orderblock the Market Maker leaves at or near the Equilibrium
Expansion Phase
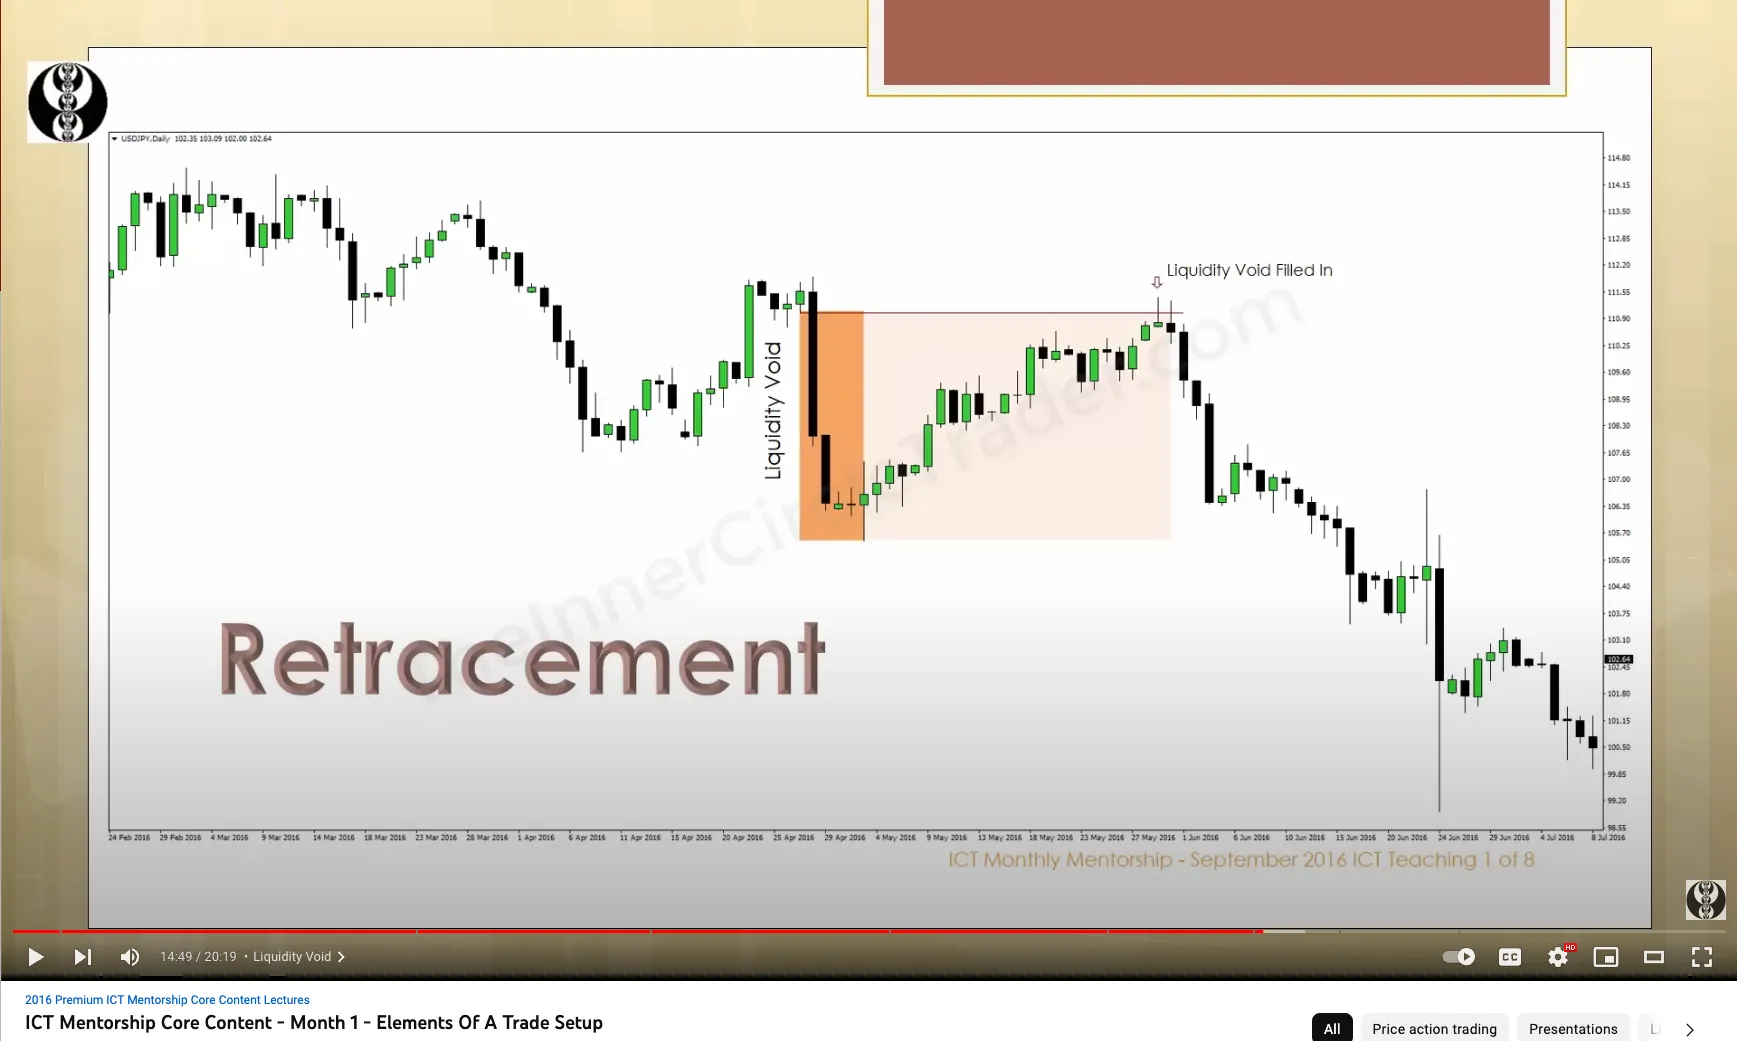
- Retracement
- Retracement occurs when price moves back inside a recently created Price Range
- Retracement goes with Liquidity Gaps (i.e. Fair Value Gaps & Liquidity Voids)
- Importance - When price returns inside a recent Price Range this indicates a willingness on the part of the Market Makers to reprice to levels not efficiently traded for Fair Value
- What do we look for in price? Fair Value Gaps & Liquidity Voids
Retracement Phase
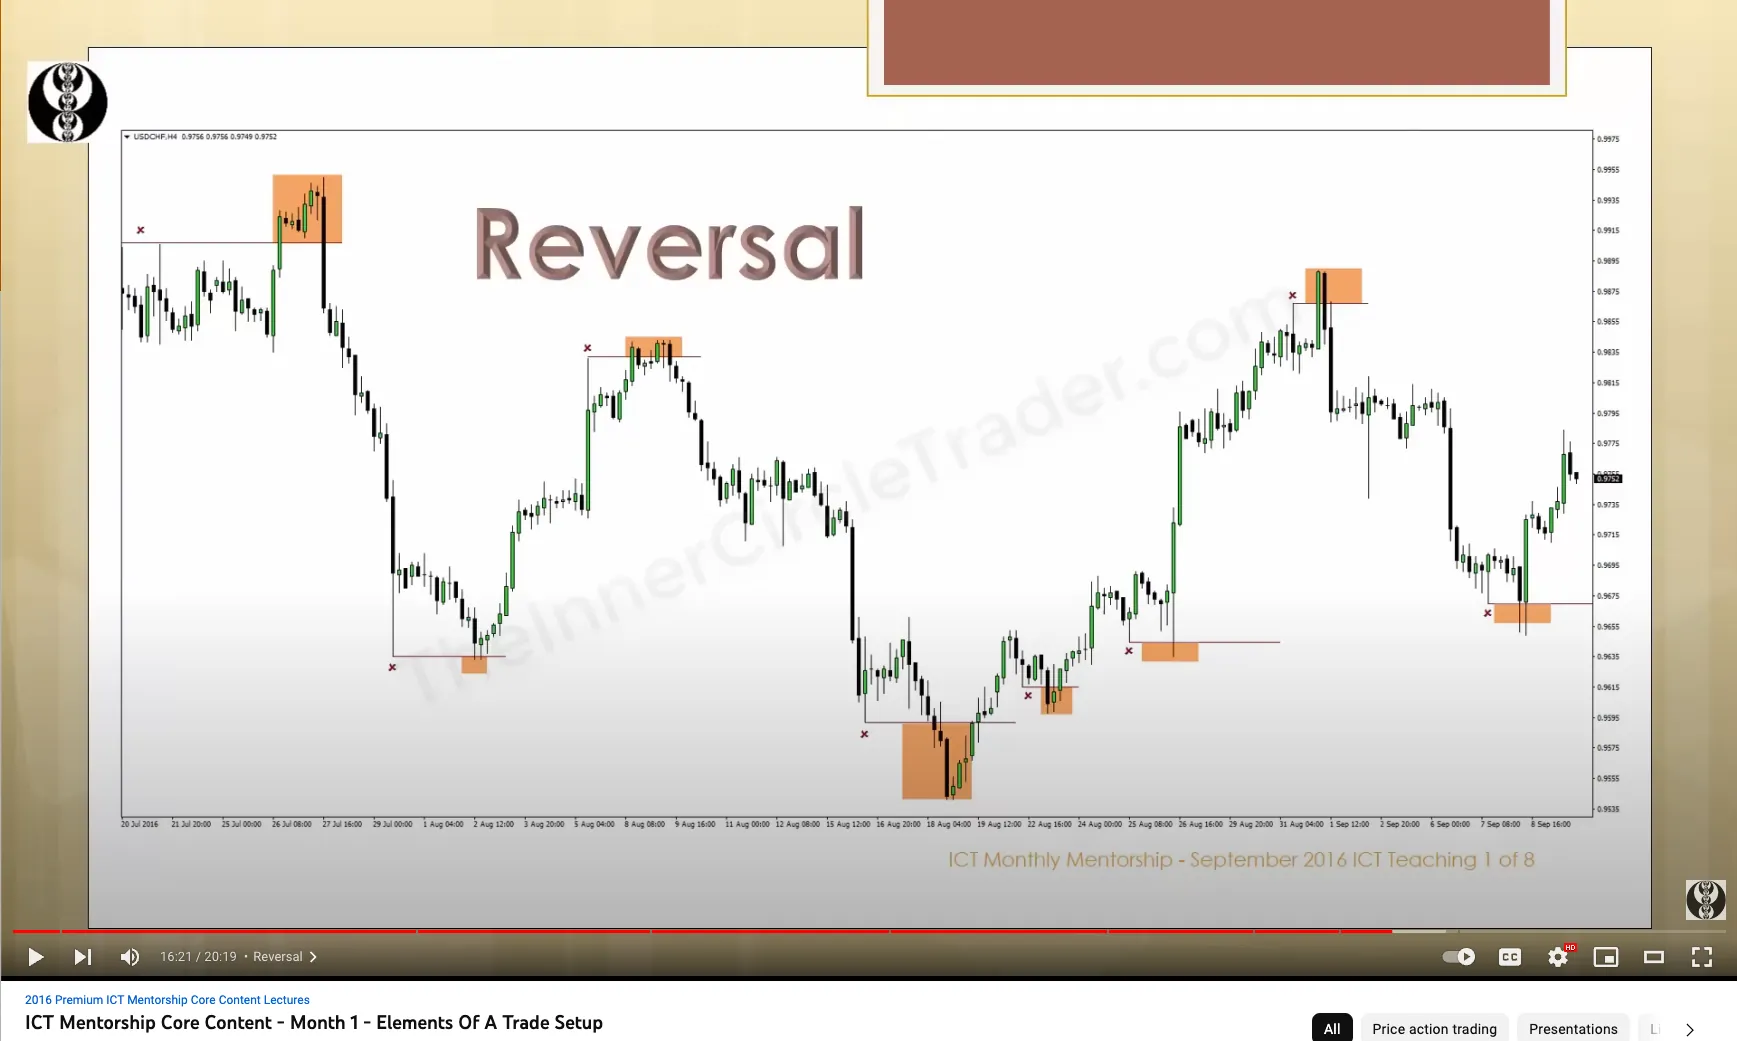
- Reversal
- Reversals occur when price moves in the opposite way compared to the direction it had been previously going
- Reversals occur after liquidity pools (i.e. Buyside Liquidity, Sellside Liquidity)
- Importance - When price reverses direction it indicates the Market Makers have run a level of Stops and a significant move should unfold in the new/opposite direction
- What do we look for in price? Liquidity Pools just above an old price high and just below an old price low
Reversal Phase
How Market Makers Condition The Market
Video 2/8
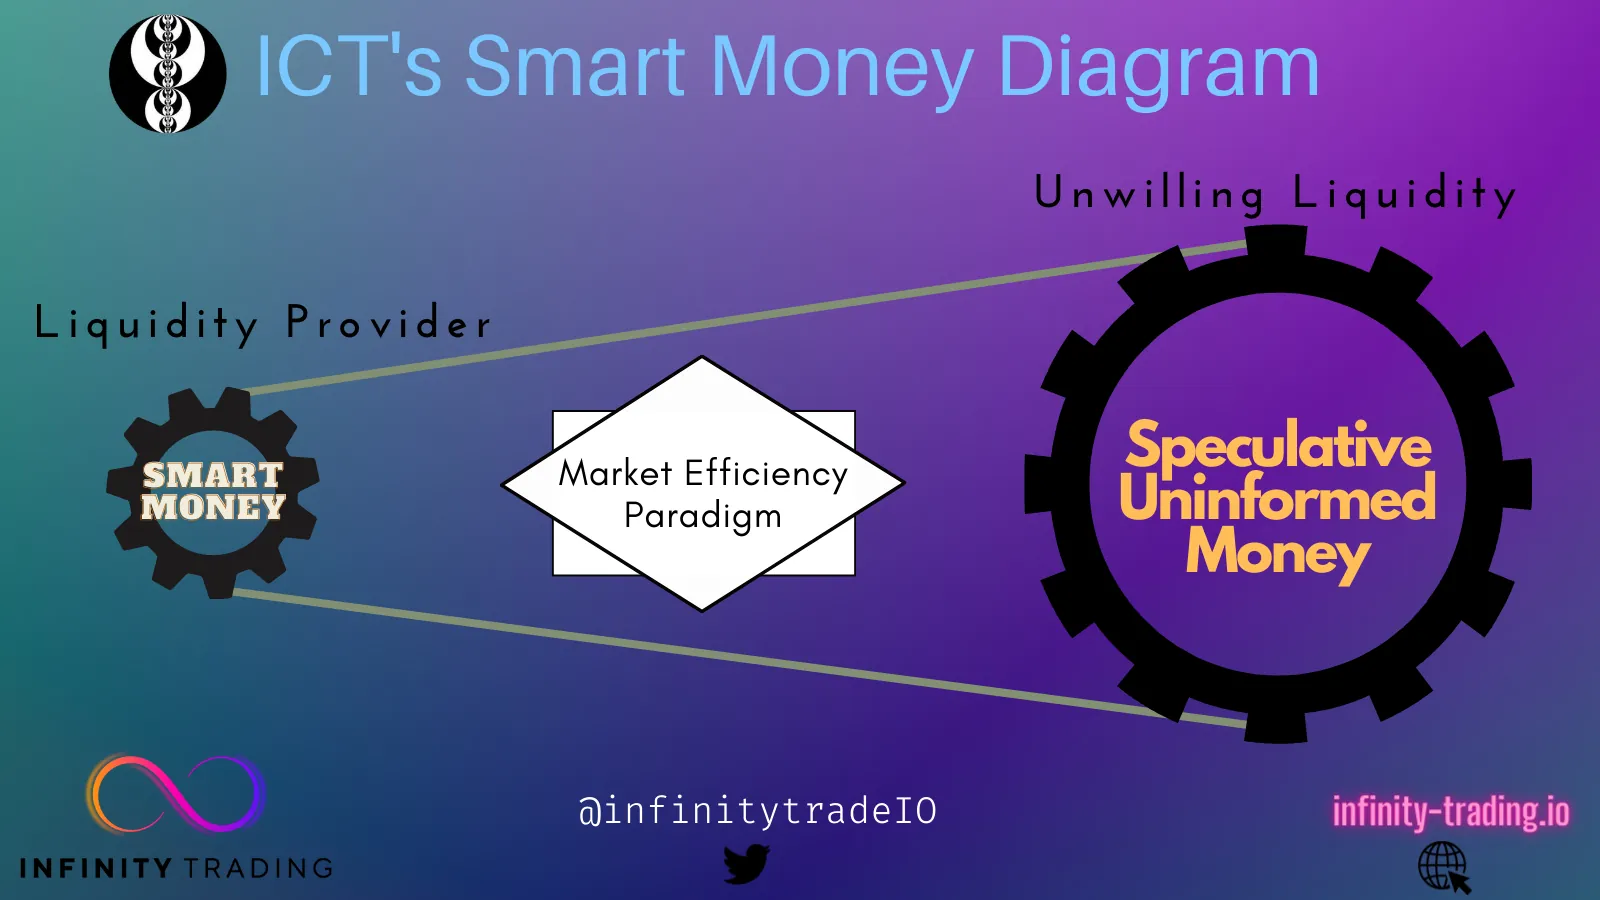
- Smart Money Diagram
- The Smart Money Diagram created by ICT depicts two gears, a belt, and a motor
- The circles are two gears; one bigger, one smaller
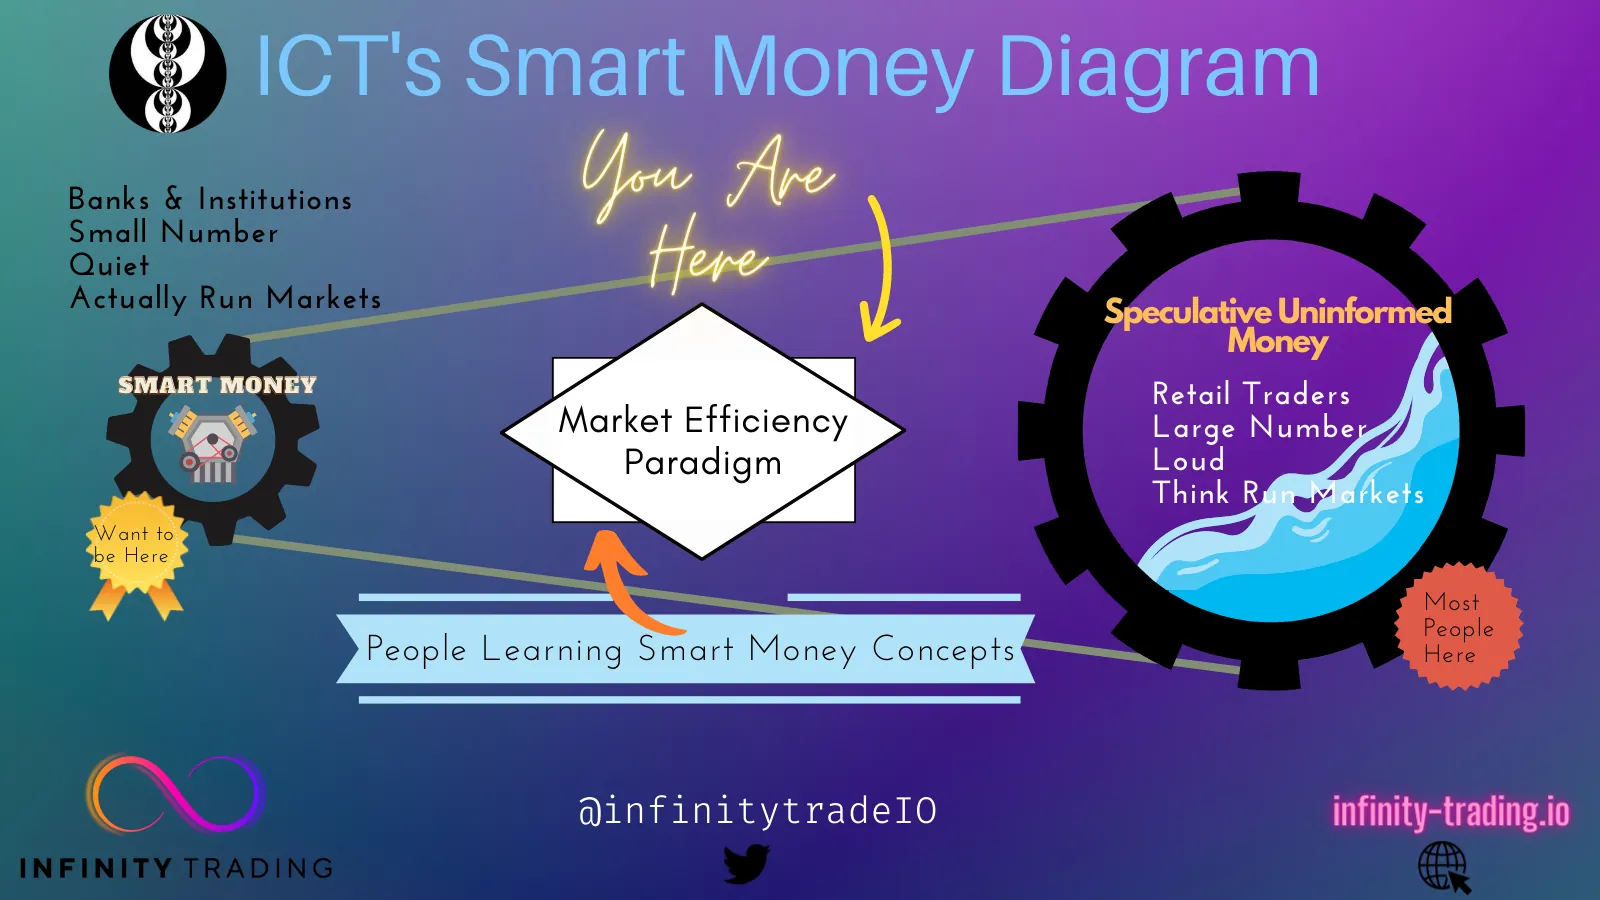
- The larger gear represents all the Retail traders. They think because of their large numbers that they make the markets go up and down
- But in reality the small gear, “Smart Money”, is actually the motor that drives the entire Market. Every price movement, up and down, is controlled by Smart Money
- Smart Money are the banks, institutions, market makers
- The Markets are priced efficiently in favor of Smart Money. Meaning price goes up and down to make Smart Money more money and to extract it from Retail traders
- The square and diamond in the middle of the belt represent traders attempting to see price action the way Smart Money does. They are trying to go from the big circle to the smaller circle
ICTs Smart Money Diagram
Detailed ICTs Smart Money Diagram
- Reference Points in Institutional Order Flow
- Orderblocks
- Fair Value Gaps & Liquidity Voids
- Liquidity Pools & Stop Runs
- Equilibrium
- Interbank Price Delivery Algorithm
- Purpose: studying the phases of the algorithm and then seeing them unfold over time helps the trader to anticipate what is most likely to happen next
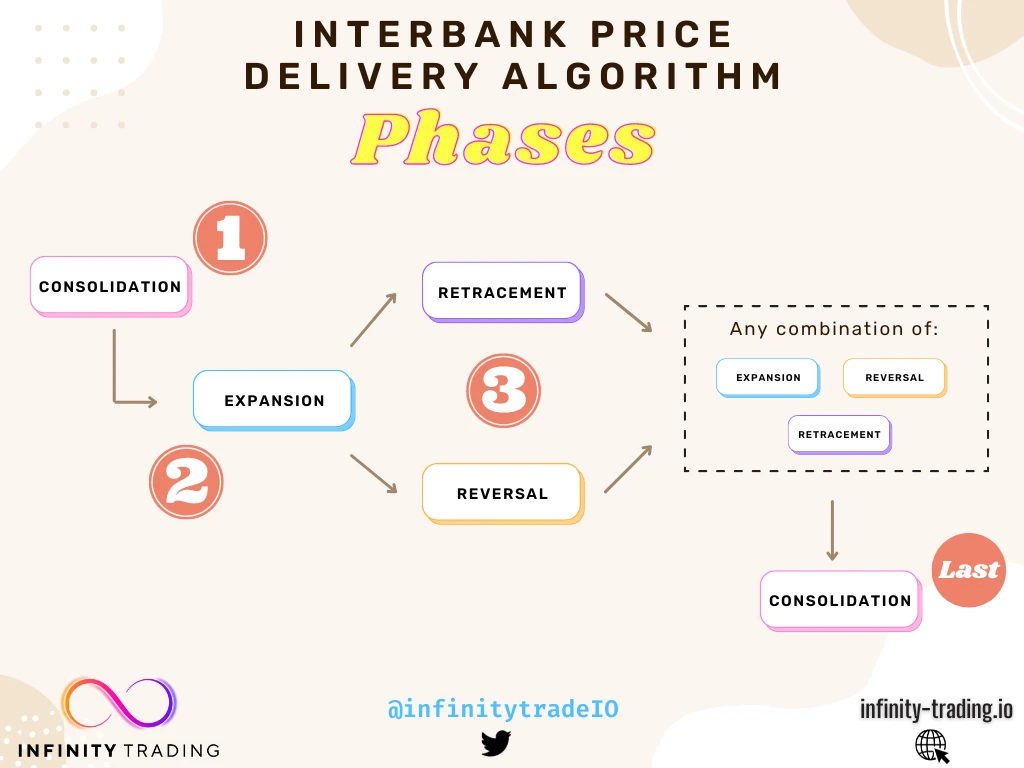
- Phases
- Consolidation
- Phase: The algorithm always starts with Consolidation
- Definition: Consolidation is when price is range bound in a tight pattern. Think of it as a holding pattern
- Purpose: Market Makers are allowing orders to accumulate above and below the consolidation range
- Next: the next phase is always Expansion
- The next phase cannot be Retracement because price cannot retrace since it is range bound
- The next phase cannot be Reversal because price first has to leave the Consolidation Range
- When you see Consolidation train yourself to think that the next price movement is going to be an explosive price move
- Expansion
- Phase: Expansion always comes after Consolidation
- Definition: an explosive price move in one direction. ICT calls this an Impulse Price Leg
- Next: the next phases are either Retracement or Reversal
- Retracement
- Definition: Retracement is when price moves back inside a recently created price range and continues going in its original direction
- Price does not overtake the beginning swing of the price leg
- Examples: Liquidity Voids and Orderblocks
- Definition: Retracement is when price moves back inside a recently created price range and continues going in its original direction
- Reversal
- Definition: Reversal is when price changes direction after hitting a pool of liquidity
- Examples: Liquidity Pools
- Consolidation
- Phase Order:
- Consolidation —> Expansion —> Retracement —> (Any combination of Expansion, Retracement, or Reversal) —> Consolidation
- Consoliation —> Expansion —> Reversal —> (Any combination of Expansion, Retracement, or Reversal) —> Consolidation
Interbank Price Delivery Algorithm
- General Daily Algorithm Structure
- Consolidation in Asian Range
- Manipulation: at midnight EST usually there is a false move
- Expansion
- Reversal in London Session (usually make the high or low of the day)
- Expansion
- Consolidation between 5am EST to 8am EST
- Expansion then Retracement many times between 8am EST to 8:30am EST
- In New York Session look for big reversals or expansions (8:30am EST to 10am EST)
- London Close many times there will be another Reversal (10:30 AM EST)
- Expansion
- Consolidation after the end of the New York Session
- The algorithm repeats itself over and over again!
- There is a certain process the way price is delivered. It cannot change and it won’t stop occurring
- The weekly range follows the same algorithm phase pattern!
- Sunday’s open is Consolidation
- Expansion move (Monday)
- Reversal
- Expansion
- Consolidation mid-week
- Reversal or Retrace
What To Focus On Right Now
Video 3/8
ICT Chart Setup
- Smart Money take trades to manipulate price for their interests only
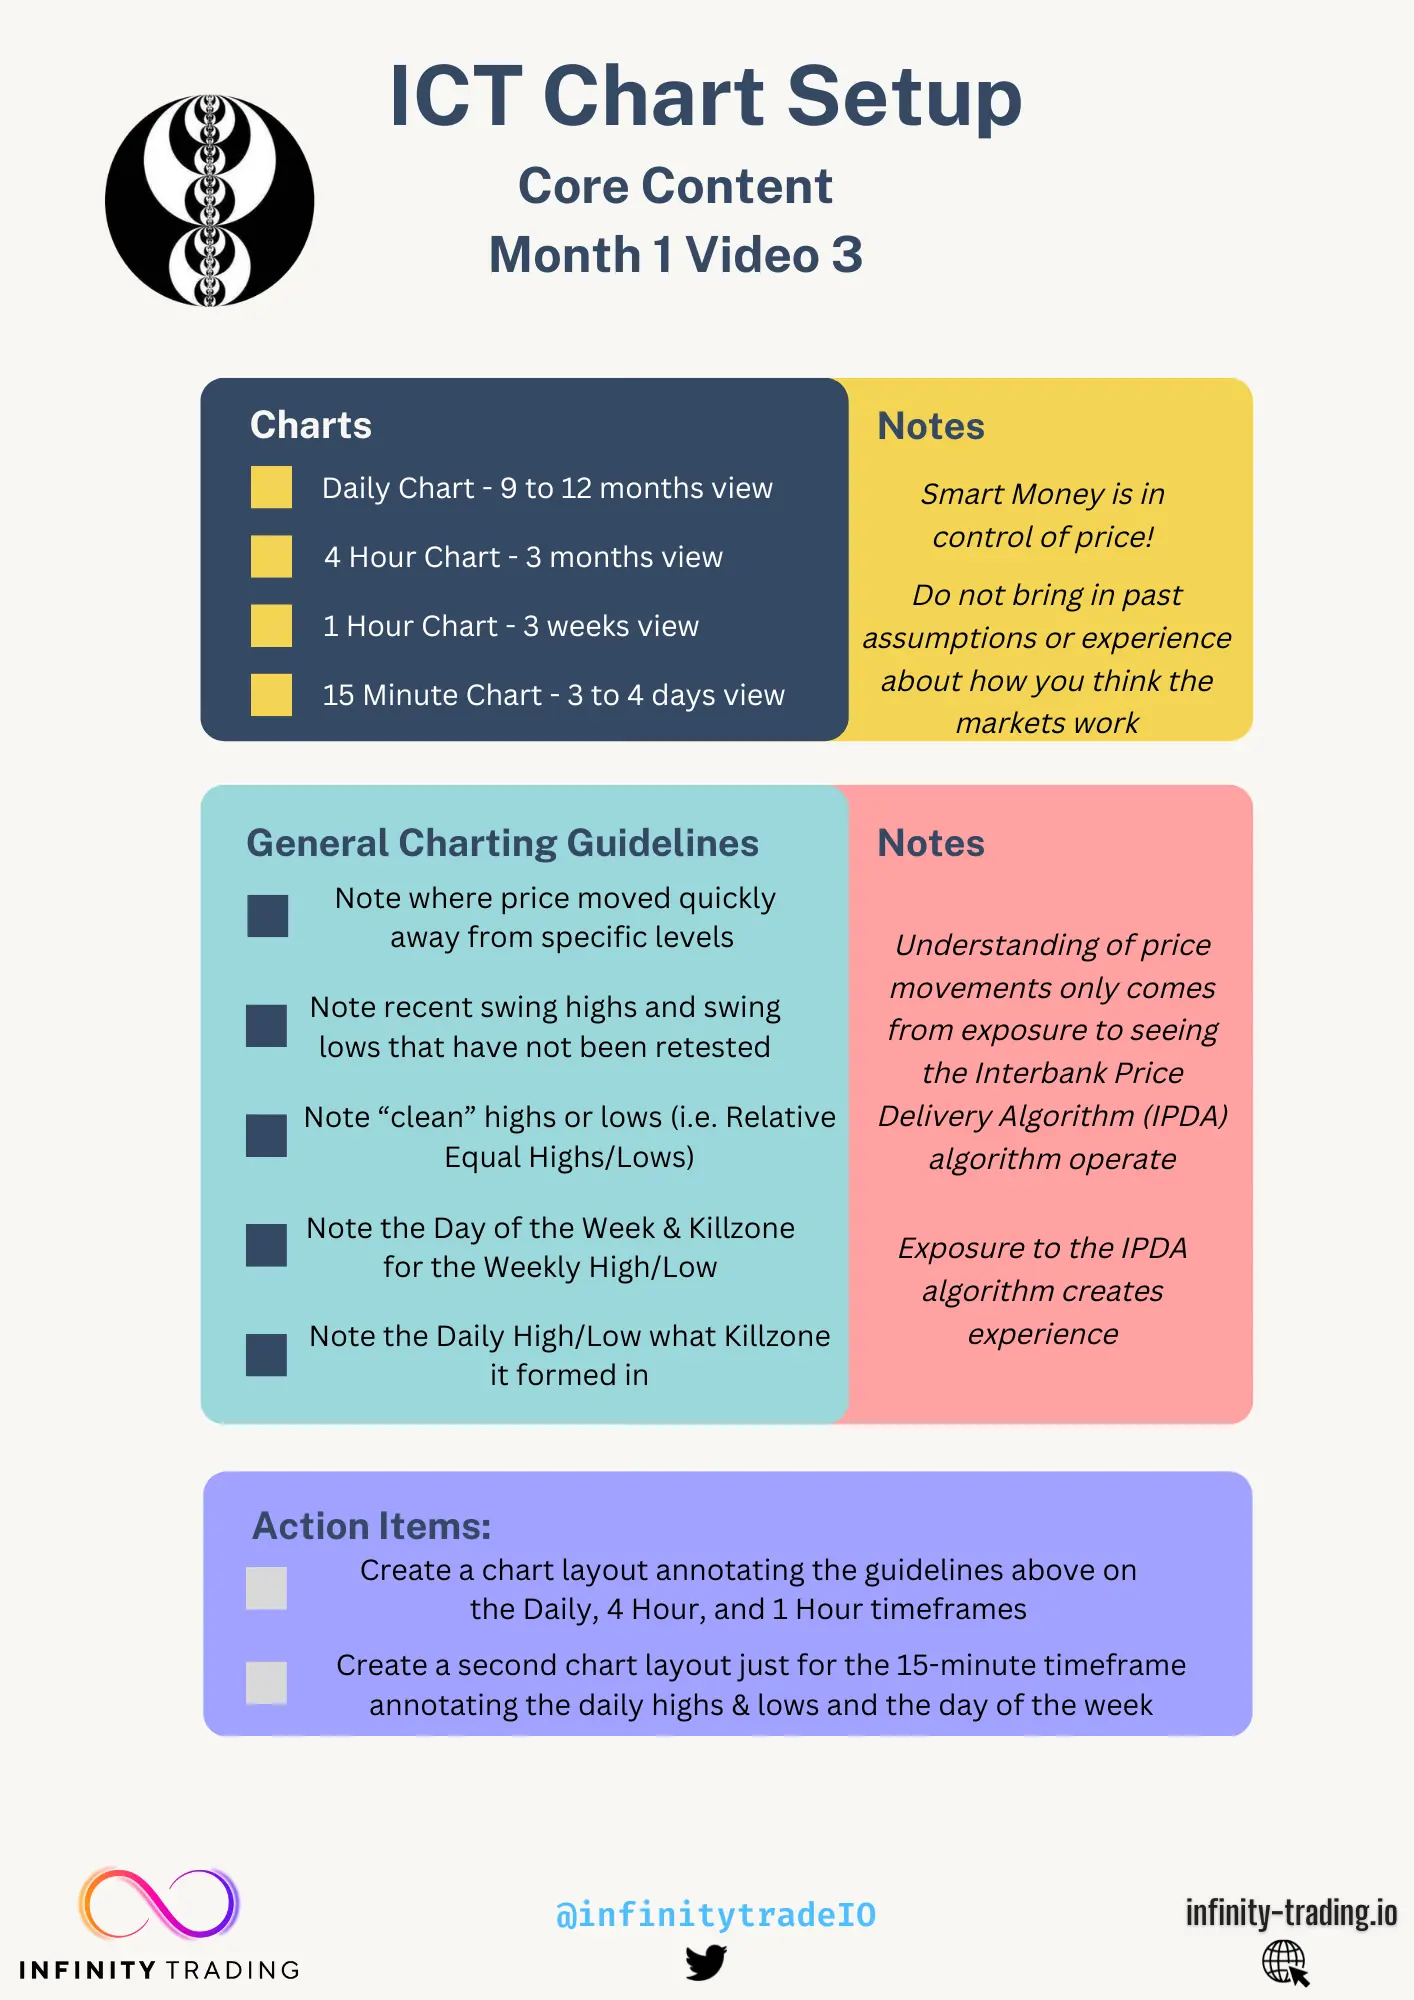
- Smart Money is in control of price!
- Smart Money offsets and liquidates their trades to move price for their purposes (this is why concepts like FVG, Orderblocks, Breakers, repeat. Because they have to! That is how Smart Money manipulates price on all the timeframes)
- Understanding The Interbank Price Delivery Algorithm (IPDA)
- Understanding of price movements only comes from exposure to seeing the IPDA algorithm operate
- Exposure to the IPDA algorithm creates experience
- What You Should Be Focused On Right Now
- Do not bring in past assumptions or experience about how you think the markets work
- In the past if you made profitable trades without using Institutional Orderflow concepts then it was just coincidence that you were profitable (i.e. pure luck)
- ICT says that if you ignore the charting steps outlined below you will stunt your growth in properly understanding Institutional Orderflow
- Create Price Action Price Charts that you update daily:
- Daily Chart - 9 months to 12 months view
- 4 Hour Chart - 3 months view
- 1 Hour Chart - 3 weeks view
- 15 Minute Chart - 3 days to 4 days view
- Resist The Urge To Forecast Price Movements Right Now
- Follow these general guidelines when annotating your charts the ICT way:
- Note on your charts where price action shows quick movements away from specific levels
- Note recent swing highs and swing lows that have not been retested (untested swing highs/lows are more influential)
- Note areas on your charts where price has left “clean” highs or lows i. Two or more equal highs/lows that formed in close price proximity to one another. Also known as Relative Equal Highs or Relative Equal Lows
- Note what days of the week the weekly highs and weekly lows formed. Also note what Killzone the weekly highs and weekly lows formed in
- Note the daily high and the daily low every trading day and what Killzone it formed in
- Create two TradingView layouts for the purposes of learning to mark your charts like ICT and to follow along with the Core Content videos
- Create a TradingView layout called “Main” and cycle though the following timeframes marking your chart as described
- Daily Chart: Note most recent price action swing highs and swing lows
- Purpose: noting highs and lows is the beginning of identifying Orderblocks, Liquidity Voids, Liquidity Pools
- 4 Hour Chart:
- Note “too clean” Relative Equal Highs or Relative Equal Lows
- Note where the market has moved quickly away from a particular level
- Purpose: These areas will be influential in your expectations of where price should and should not go
- 1 Hour chart: Mark anything that you think looks important
- Hourly chart is useful for understanding the weekly range and intraday highs and lows
- Daily Chart: Note most recent price action swing highs and swing lows
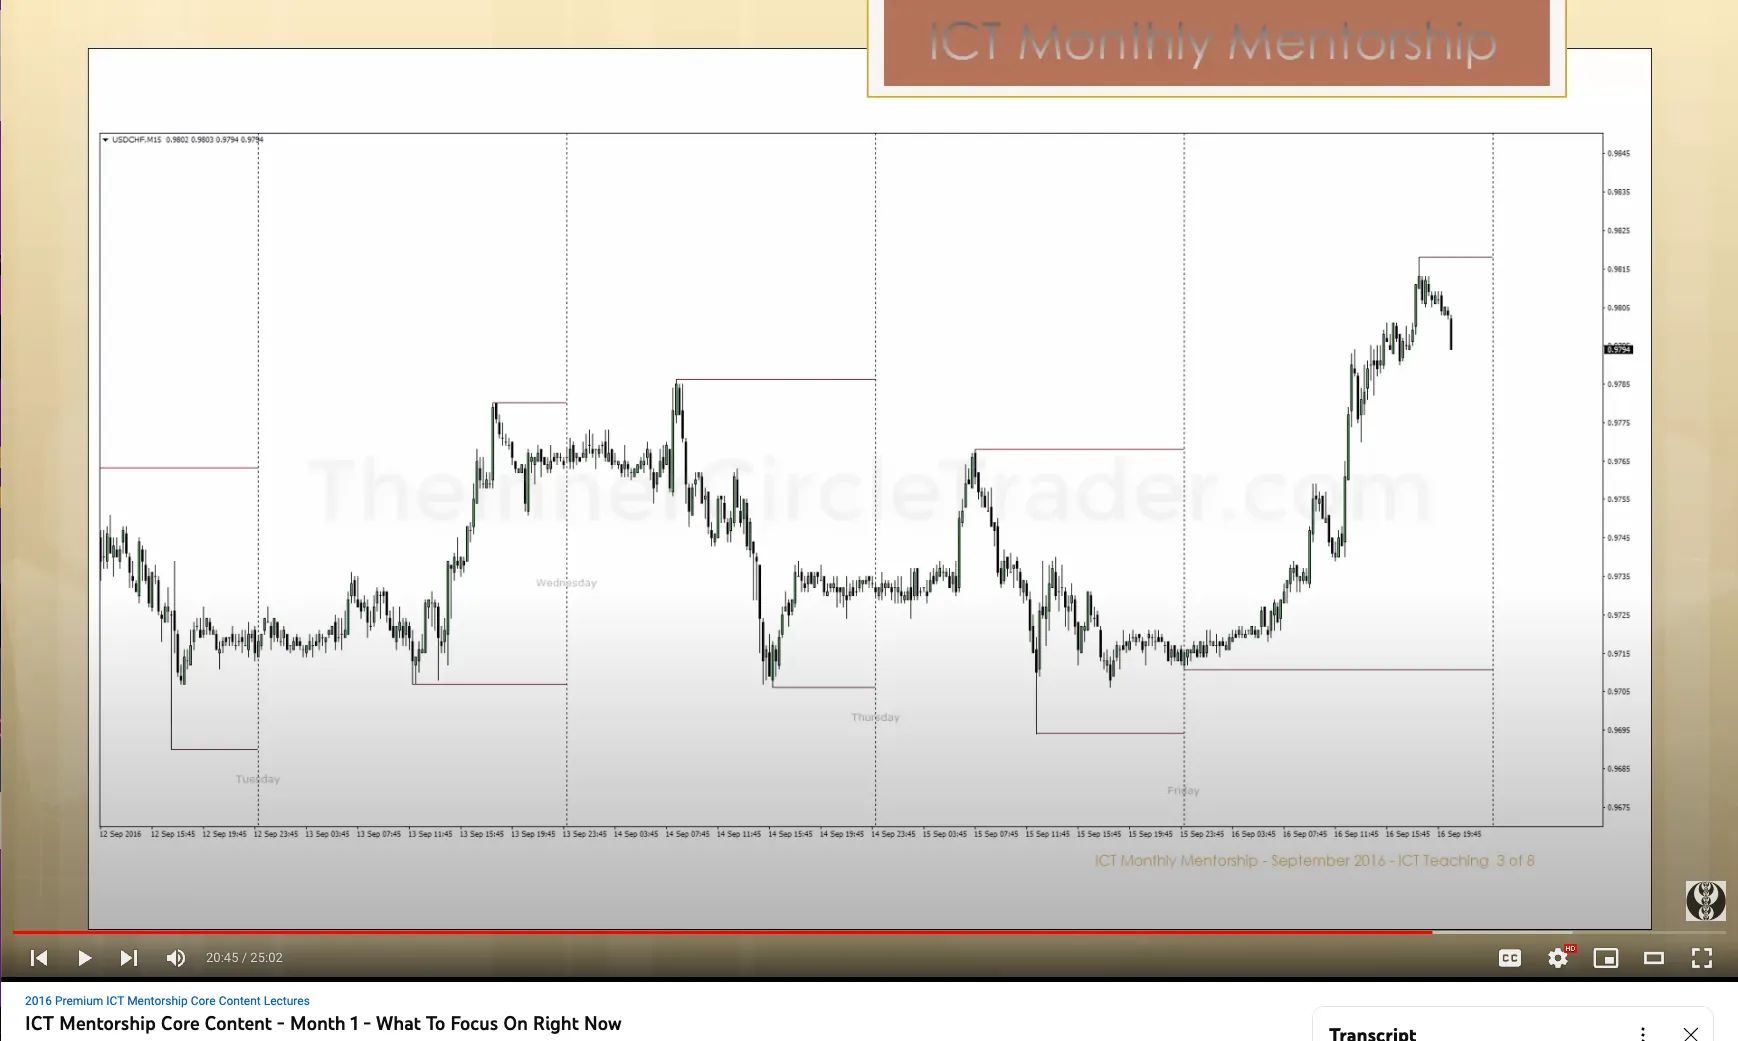
- Create a second TradingView layout called “Bellwether” just for the 15-minute timeframe
- Just look at the last 3 days of trading
- Note the daily highs and lows
- Note the days of the week
- My free TradingView indicator Weekly Power 3 intelligently places the Days of the Week on your charts for you!
- Purpose: Noting the days of the week and the daily highs and lows on the 15-min allows you to easily see how price takes out liquidity and the ranges it makes
- Create a TradingView layout called “Main” and cycle though the following timeframes marking your chart as described
Daily Chart
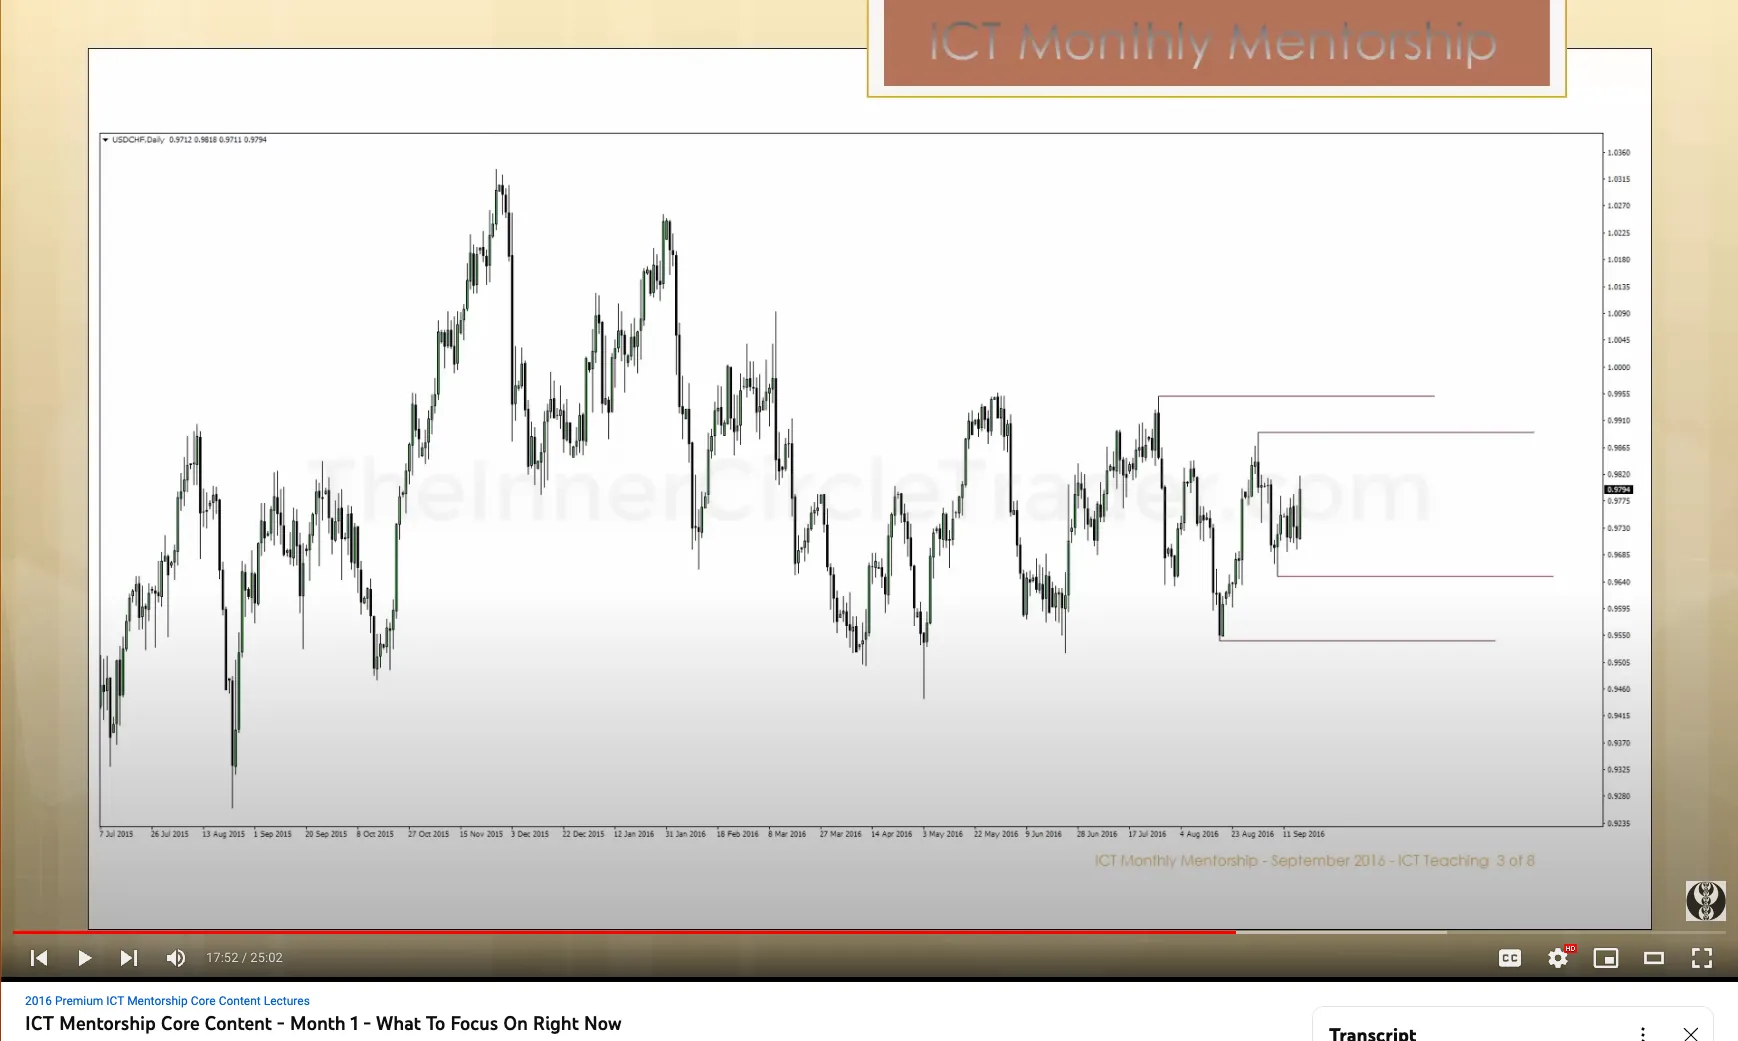
Daily Chart Liquidity Pools
4 Hour Chart
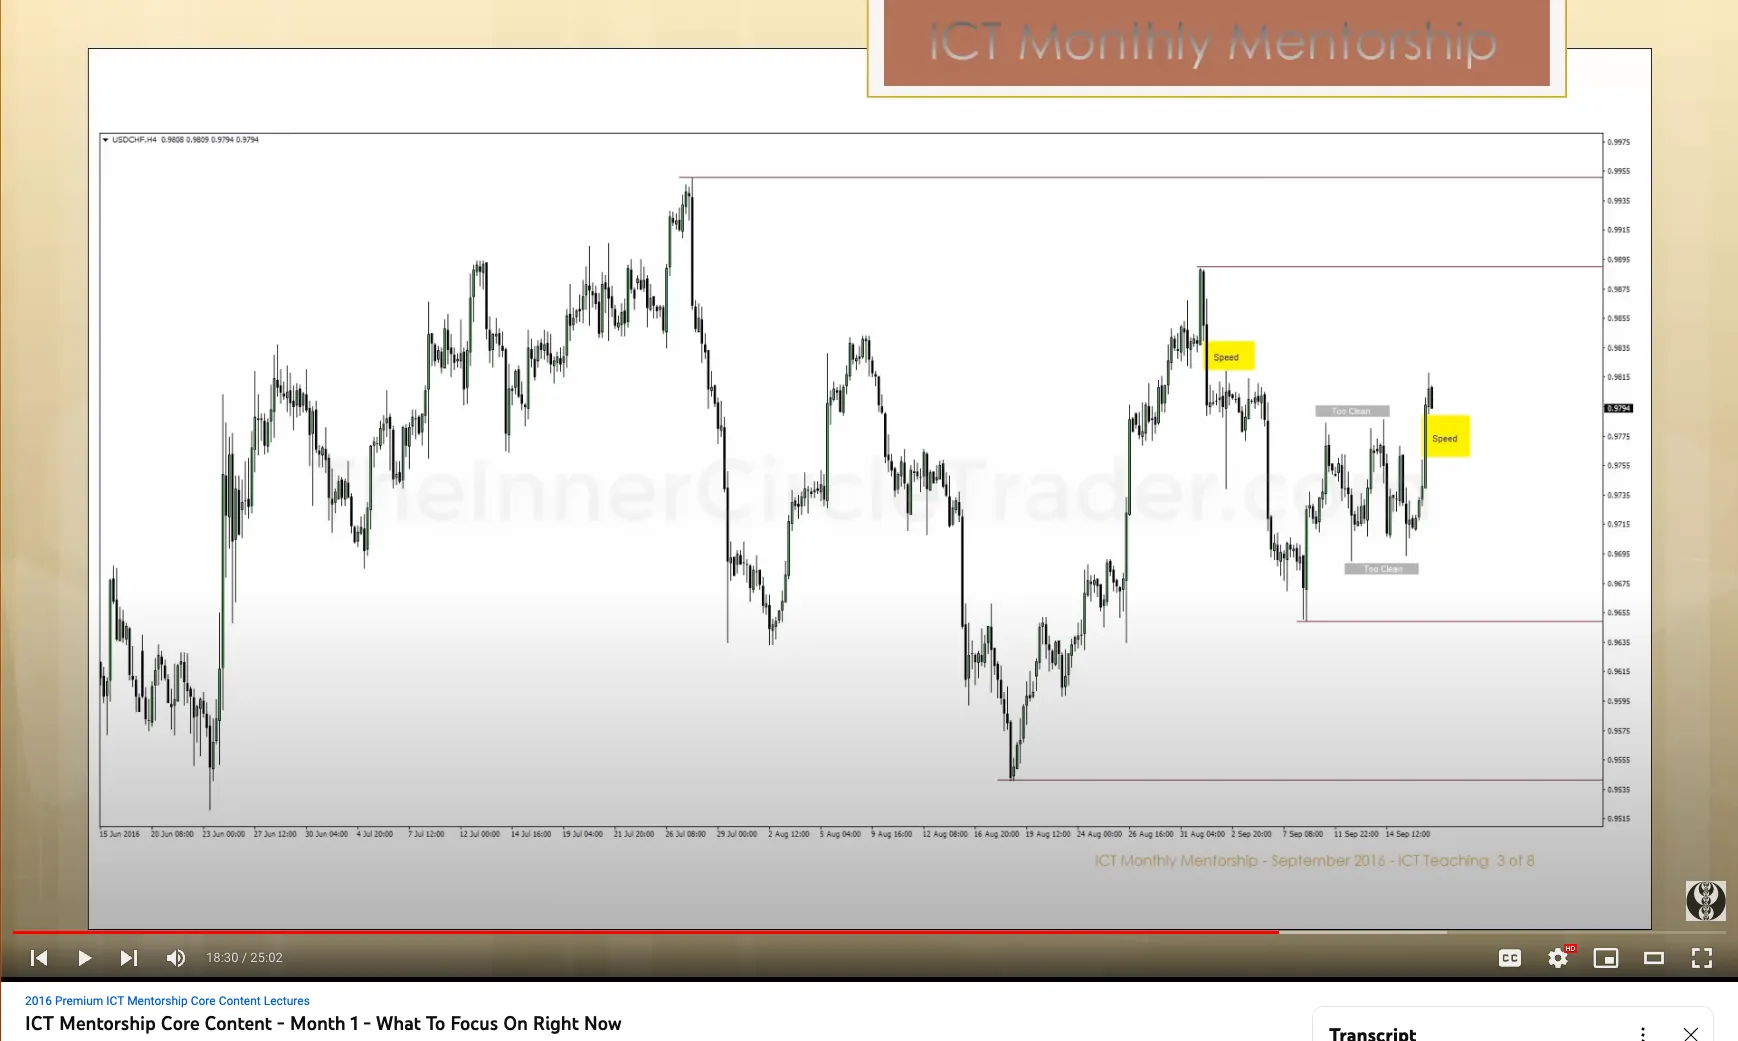
4 Hour Chart Relative Equal Highs and Lows
1 Hour Chart
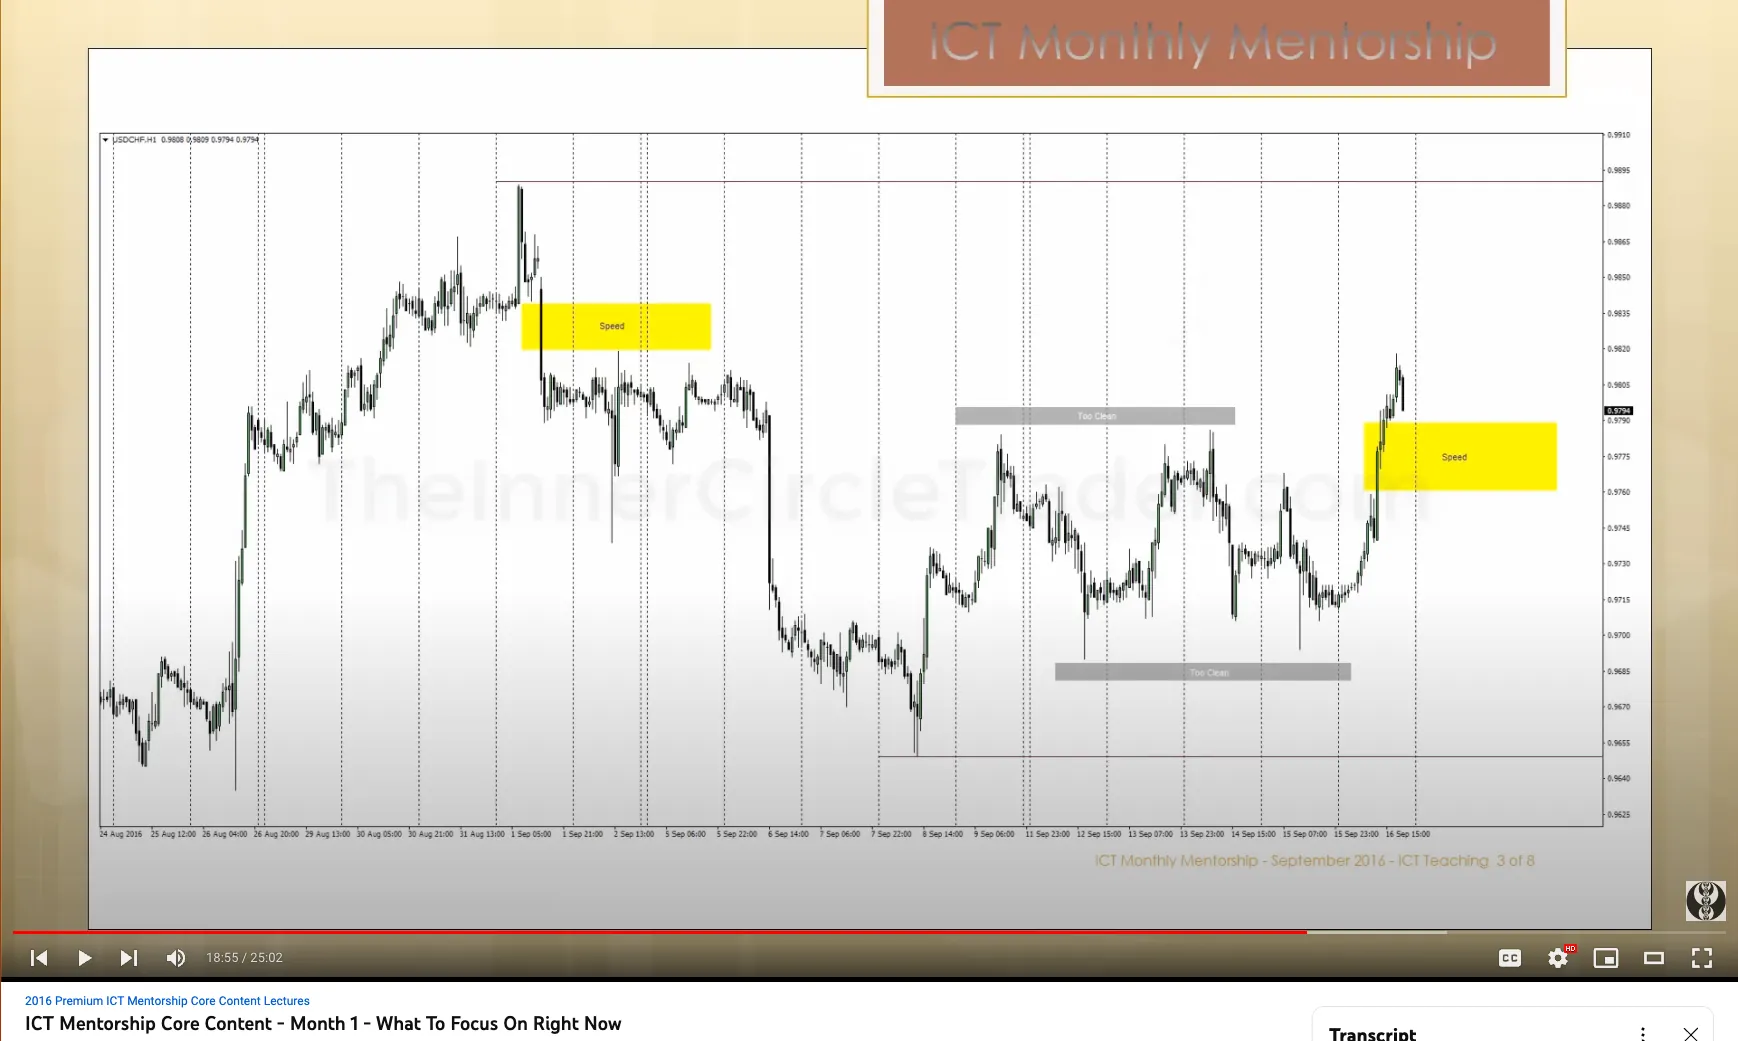
1 Hour Chart
15 Minute Chart