
Intraday Power 3 Visual
This TradingView indicator draws a dynamic “Open High Low Close” type visual on intraday charts so the trader can easily keep track of the daily/weekly movement. This indicator was inspired by the Inner Circle Trader’s (ICT) “Power 3” concept, which is Accumulation, Manipulation, and Distribution of price on a daily timeframe .
Visual
This indicator plots the chosen timeframes opening price along with a live line for the current price. This makes it very easy to identify the daily/weekly range along it’s open. And the user can combine this indicator with my other indicator Futures Exchange Sessions to plot the midnight EST & 8:30 AM EST lines to get a great summation of over night price action.
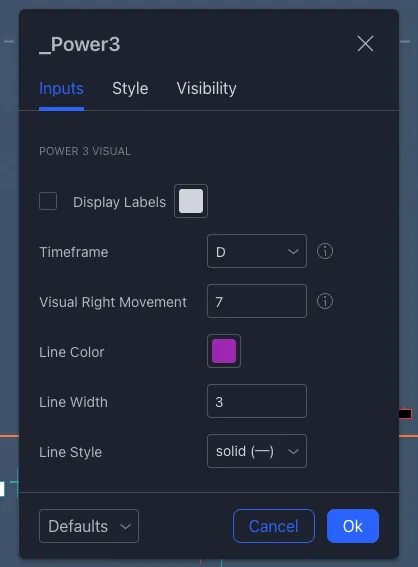
Inputs and Style
In the Input section the user can dynamically switch between Daily and Weekly timeframes. Built in ability to move the entire Visual to the right makes preventing indicator overlap a breeze. All of the lines can be configured: color, style, and width. Independently toggle ON/OFF the Power 3 labels (Accumulation, Manipulation, Range Extension, Distribution) and can change labels color. The labels dynamically move and switch positions based upon bear or bull daily/weekly range.
Special Notes
The Futures market is open 23/5. It is closed everyday for 1-hour at 5pm EST and closed over the weekends. Because this Intraday Power 3 Visual is drawing in the ‘future’ on the users TradingView chart, when the visual is close or in a time when the market is closed, the visual doesn’t behave properly. This is because TradingView doesn’t display times when the Market is closed, thus the drawings cannot be displayed during those times. There is nothing wrong with the script. Please wait until the Market is open and the visual will be drawn normally.
This indicator is intended for use in the Futures Market
Screenshots
Power 4 Visual TradingView Indicator Settings
Code
// © Infinity_Trading_
// Last Modified: 5/5/2022

//@version=5
indicator(title="Intraday Power 3 Visual", shorttitle="_Power3", overlay=true)

// Purpose: Draws an "Open High Low Close" type visual on an intraday chart to the right of the current price action.
//          This visual allows the trader to easily see the current days/weeks range and when it opened and it's current close.
//          This visual allows the trader to easily indentify Power 3 conceps created by the Inner Circle Trader (ICT) - Accumulation, Manipulation, & Distribution


// Usage: Switch between drawing Daily or Weekly range
//        Ability to move the Visual to the right of the current candles. Lines: user has option to change the lines color, style, and width.
//        Independently toggle ON/OFF the Power 3 labels (Accumulation, Manipulation, Range Extension, Distribution) and can change labels color.
//        Labels dynamically move and switch positions based upon bear or bull daily/weekly range.


// Note: this indicator is intended for use in the Futures Market

// Note 2: when the chart timeframe is 12hr, 4hr, 2hr the horizontal lines can appear unproportial because of Market closed times

///////////////////////////////////////////////////////////////////////////////// INPUTS


var string GP3 = "Power 3 Visual"
i_label_toggle = input.bool(defval=false, title="", group=GP3, inline="labels")
i_label_text_color = input.color(defval=color.rgb(255, 255, 255, 0), title="Display Labels", group=GP3, inline="labels")
c_tooltip_timeframe = "Switch the Power 3 Visual between the current Day or current Week"
i_timeframe = input.timeframe(defval="D", title="Timeframe", options=["D", "W"], group=GP3, tooltip=c_tooltip_timeframe)
c_tooltip_move = "The Futures market is open 23/5. It is closed everyday for 1-hour at 5pm EST and closed over the weekends. Because this Intraday Power 3 Visual is drawing in the 'future' on the users TradingView chart, when the visual is close or in a time when the market is closed, the visual doesn't behave properly. This is because TradingView doesn't display times when the Market is closed, thus the drawings cannot be displayed during those times. There is nothing wrong with the script. Please wait until the Market is open and the visual will be drawn normally."
i_right_movement = input.int(defval=5, minval=1, step=1, title="Visual Right Movement", group=GP3, tooltip=c_tooltip_move)
i_line_color = input.color(defval=color.rgb(255, 255, 255, 0), title="Line Color", group=GP3)
i_line_width = input.int(defval=2, minval=1, maxval=20, step=1, title="Line Width", group=GP3)
i_line_style = input.string(defval="solid (─)", title="Line Style", options=["solid (─)", "dotted (┈)", "dashed (╌)"], group=GP3)


///////////////////////////////////////////////////////////////////////////////// HELPER FUNCTIONS


// Function the converts string inputs to line style code
line_style_function(input_var) =>
    switch input_var
        "dotted (┈)" => line.style_dotted
        "dashed (╌)" => line.style_dashed
        => line.style_solid


///////////////////////////////////////////////////////////////////////////////// TIMEFRAME


timeframe_high = request.security(syminfo.tickerid, i_timeframe, high)
timeframe_low = request.security(syminfo.tickerid, i_timeframe, low)
timeframe_open = request.security(syminfo.tickerid, i_timeframe, open)
timeframe_close = request.security(syminfo.tickerid, i_timeframe, close)

///////////////////////////////////////////////////////////////////////////////// BULL & BEAR VARIABLES

var float manipulation_value = na
var float distribution_value = na
range_explansion_value = (timeframe_open + timeframe_close) / 2


// Sets values based on whether daily/weekly range is bear or bull direction
if timeframe_open > timeframe_close
    // Bearish candle
    manipulation_value := (timeframe_open + timeframe_high) / 2
    distribution_value := (timeframe_close + timeframe_low) / 2
else
    // Bullish candle
    manipulation_value := (timeframe_open + timeframe_low) / 2
    distribution_value := (timeframe_close + timeframe_high) / 2

///////////////////////////////////////////////////////////////////////////////// POWER 3 VISUAL

// Move timebased labels right
dt = time + i_right_movement * (time - time[1])
dt_current = time + (i_right_movement * 2) * (time - time[1])

// Visual line style
line_style_power3 = line_style_function(i_line_style)

// Set defaults for all lines and labels
var line line_vertical = na
var line line_power3_open = na
var line line_power3_current = na
var label label_range_expansion = na
var label label_accumulation = na
var label label_manipulation = na
var label label_distribution = na

// Saves TradingView resources by only drawing the visual once
if timeframe.isintraday and barstate.islast
    // Draw Power 3 lines

    // Vertical line
    line_vertical := line.new(x1=dt, y1=timeframe_high, x2=dt, y2=timeframe_low, xloc=xloc.bar_time, color=i_line_color, style=line_style_power3, width=i_line_width)
    line.delete(line_vertical[1])
    // Left horizontal line
    line_power3_open := line.new(x1=time, y1=timeframe_open, x2=dt, y2=timeframe_open, xloc=xloc.bar_time, color=i_line_color, style=line_style_power3, width=i_line_width)
    line.delete(line_power3_open[1])
    // Right horizontal line
    line_power3_current := line.new(x1=dt, y1=timeframe_close, x2=dt_current, y2=timeframe_close, xloc=xloc.bar_time, color=i_line_color, style=line_style_power3, width=i_line_width)
    line.delete(line_power3_current[1])

    // Toggle on/off lables
    if i_label_toggle
        // Place labels

        // Range Expanseion label
        label_range_expansion := label.new(x=dt, y=range_explansion_value, text="Range Expansion", xloc=xloc.bar_time, style=label.style_none, textcolor=i_label_text_color, textalign=text.align_center, tooltip="Range Expansion is ...")
        label.delete(label_range_expansion[1])
        // Accumulation label
        label_accumulation := label.new(x=dt, y=timeframe_open, text="Accumulation", xloc=xloc.bar_time, style=label.style_none, textcolor=i_label_text_color, textalign=text.align_right, tooltip="Accumulation is ...")
        label.delete(label_accumulation[1])
        // Manipulation label
        label_manipulation := label.new(x=dt, y=manipulation_value, text="Manipulation", xloc=xloc.bar_time, style=label.style_none, textcolor=i_label_text_color, textalign=text.align_center, tooltip="Manipulation is ...")
        label.delete(label_manipulation[1])
        // Distribution label
        label_distribution := label.new(x=dt, y=distribution_value, text="Distribution", xloc=xloc.bar_time, style=label.style_none, textcolor=i_label_text_color, textalign=text.align_center, tooltip="Distribution is ...")
        label.delete(label_distribution[1])