The notes below are combined from the videos “Equilibrium Vs. Discount” & “Equilibrium Vs. Premium” since both videos use the same model but just in different directions.
Equilibrium Vs. Discount
Video 4/8
Equilibrium Vs. Premium
Video 5/8
Premium vs. Discount Model Notes
Definitions
- Swing High/Low = four candles on any timeframe
- Swing High
- Start with any candle
- 2nd candle has a higher high than 1st candle
- 3rd candle has a lower high than the 2nd candle
- 4th candle has a lower high and a lower low than the 3rd candle
- Swing Low
- Start with any candle
- 2nd candle has a lower low than the 1st candle
- 3rd candle has a higher low than the 2nd candle
- 4th candle has a higher low and a higher high than the 3rd candle
- Swing High
- Market Range = the largest range in price between any swing high and swing low on a chart. Look for swing highs and swing lows with the strongest retrace reactions
- Impulsive Price Swing = the indication that there has been displacement at that level
- Displacement = location in price where someone with a lot of money comes into the marketplace with a strong conviction to move price higher or lower very quickly
- Displacement is characterized by strong and quick price movement that leave behind Fair Value Gaps
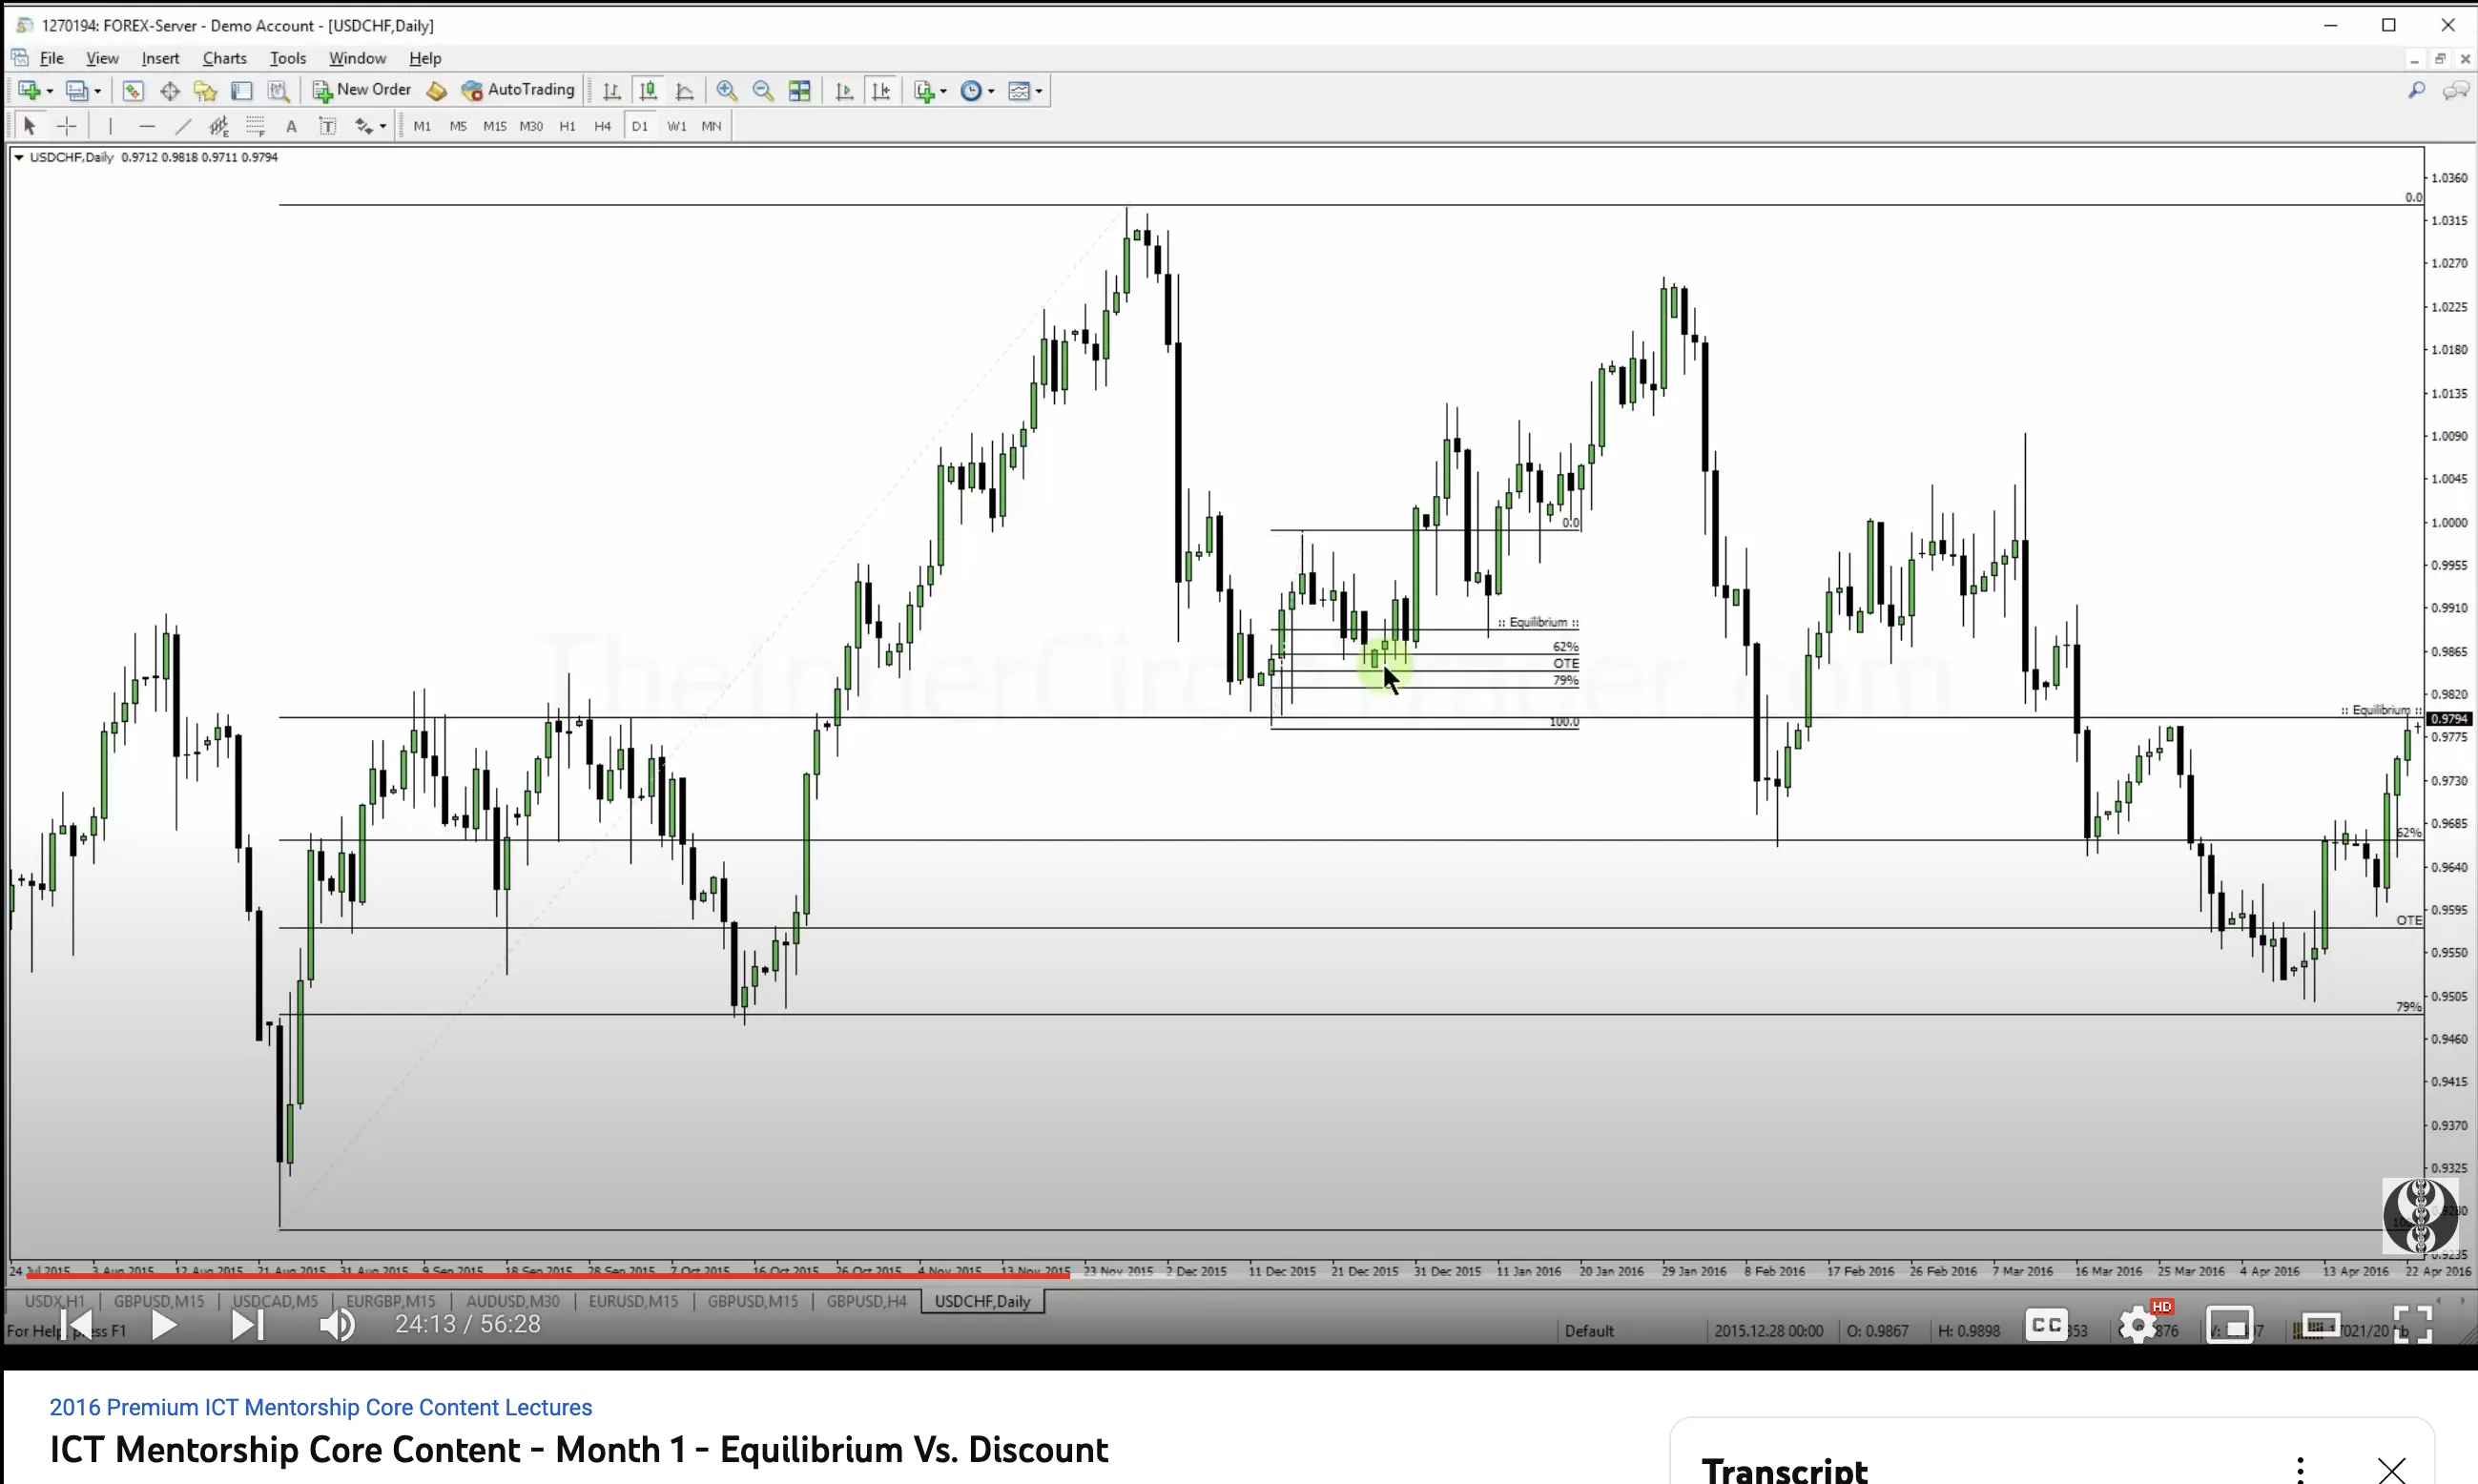
- Equilibrium = the midway point between a swing high and a swing low
- Also known as the Fair Market Value because it represents a fair price between the swing high and swing low
Drawing
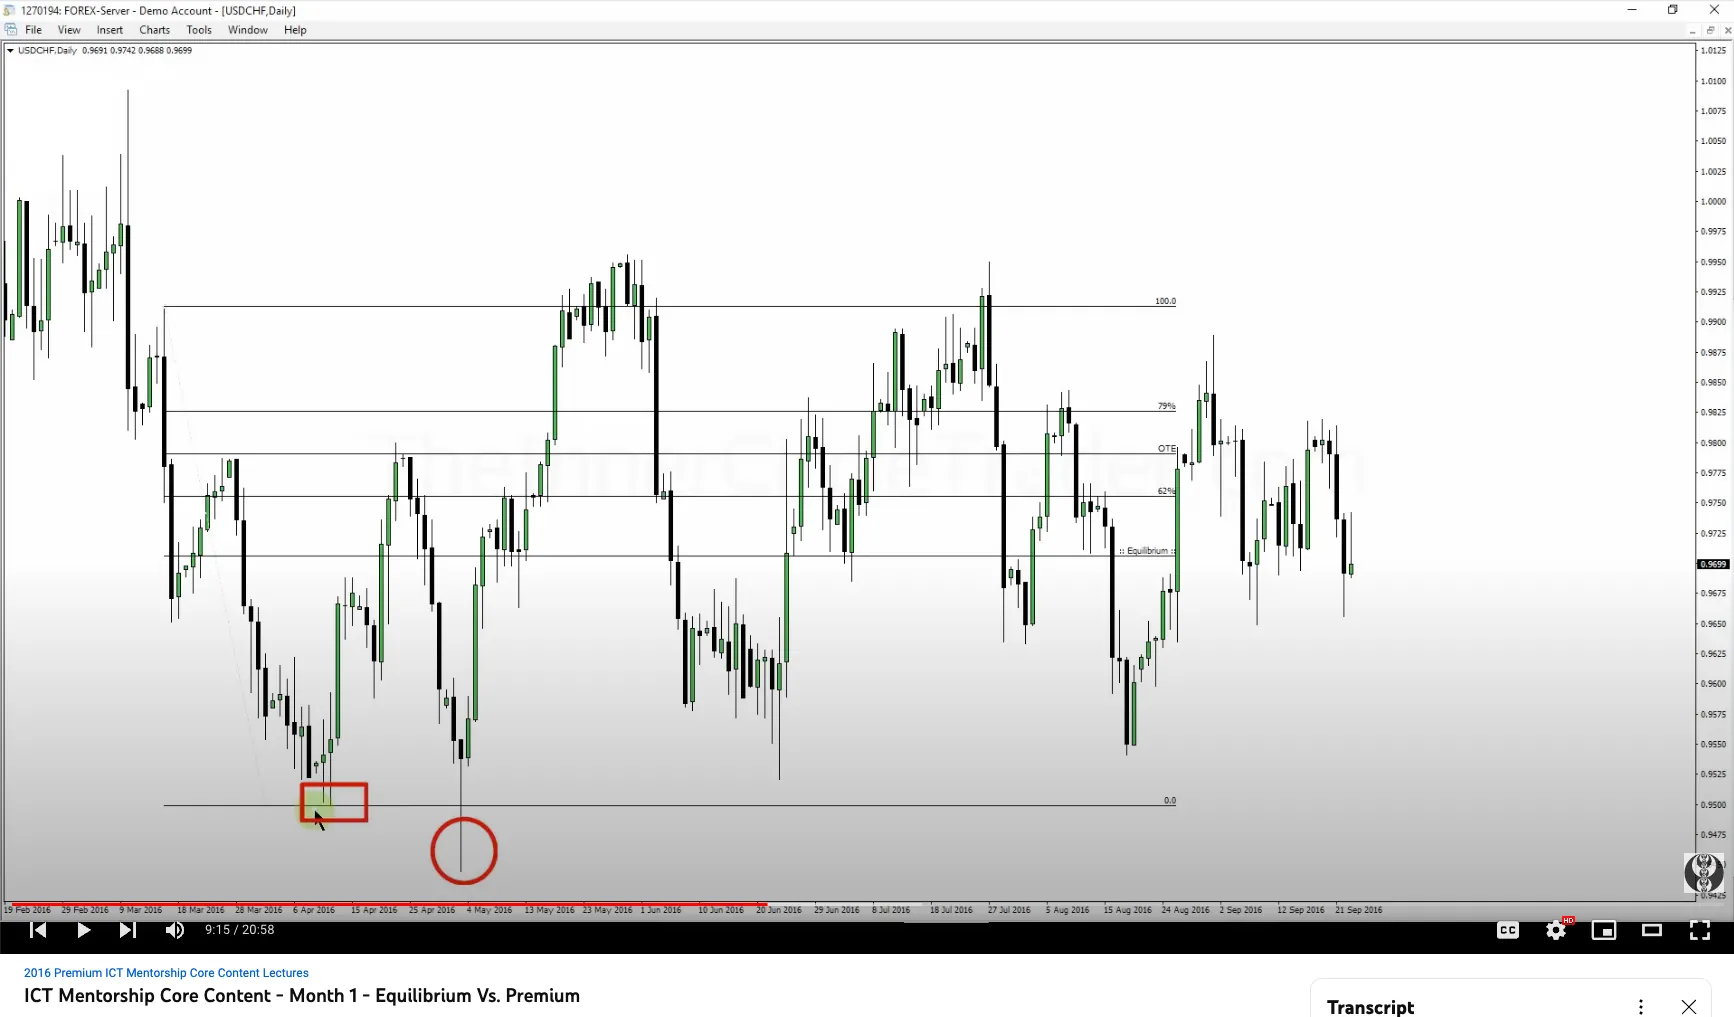
- Use the Fibonacci Retracement drawing tool on your charting platform that draws lines at the 0, 0.5, 1 levels. Or the 0%, 50%, & 100% levels
- Drawing on Down Moves
- Use the Fib Retracement tool to draw a 50% level from a swing high to a swing low drawing from left to right
- Remember that a swing high or swing low requires 4 candles
- The Fibonacci 50% level is the Equilibrium of the price swing
- If there are multiple swing highs close together to pick from then chose the swing high that is the most recent or closest to the move down
- Use the Fib Retracement tool to draw a 50% level from a swing high to a swing low drawing from left to right
- Drawing on Up Moves
- Use the Fib Retracement tool to draw a 50% level from a swing low to a swing high drawing from left to right
- Remember that a swing high or swing low requires 4 candles
- The Fibonacci 50% level is the Equilibrium of the price swing
- If there are multiple swing lows close together to pick from then chose the swing low that is the most recent or closest to the move up
- Use the Fib Retracement tool to draw a 50% level from a swing low to a swing high drawing from left to right
- The best way to start drawing Equilibrium lines is to find the most obvious Impulse Price Swing on your charts and work from there
Purpose
- The purpose of the Premium vs Discount Line is a framework to help the trader find higher probability entries
- When price is in a Premium it can be considered Over Bought and when price is in a Discount it is Over Sold
- The Premium vs Discount Line is the original Overbought or Oversold indicator!
Characteristics
- Equilibrium
- When price retraces past the Equilibrium level (from premium to a discount in an up swing, or from discount to premium in a down swing) it does NOT spend much time below Equilibrium
- Generally there is a very dynamic price movement away from Equilibrium (especially if there is a higher timeframe context)
- This happens because if price is in a Discount and the underlying bias is bullish then price won’t stay in a Discount very long because the banks and institutions will be buying because price is cheap
- Just like when a sought after item at the store is at a discount people will move quickly to by the item because they deem the price to be a good value
- As soon as the price reaches Equilibrium and below the algorithm will kick to buy mode and start sending the price higher
- When price retraces past the Equilibrium level (from premium to a discount in an up swing, or from discount to premium in a down swing) it does NOT spend much time below Equilibrium
- Optimal Trade Entry (OTE)
- The OTE levels are the range 0.62 to 0.79 on the Fibonacci Drawing tool (or 62% to 79%)
- The midway points of the OTE range is 0.705 or 70.5%
- In a Bullish price swing the OTE range (Discount) is the highest probability location to go long in
- In a Bearish price swing the OTE range (Premium) is the highest probability location to go short in
- The OTE levels are the range 0.62 to 0.79 on the Fibonacci Drawing tool (or 62% to 79%)
Trading w/ Premium vs Discount Line
- Buy in a Discount & Sell in a Premium
- One Premium vs Discount Line
- Look for swing highs and swing lows that satisfy the four candle requirements
- Draw the Fibonacci 50% line between the swing high and swing low
- Equilibrium is the midway point of a range
- Wait for price to retrace back to the Equilibrium level
- Expect an aggressive impulse price leg away from the Equilibrium
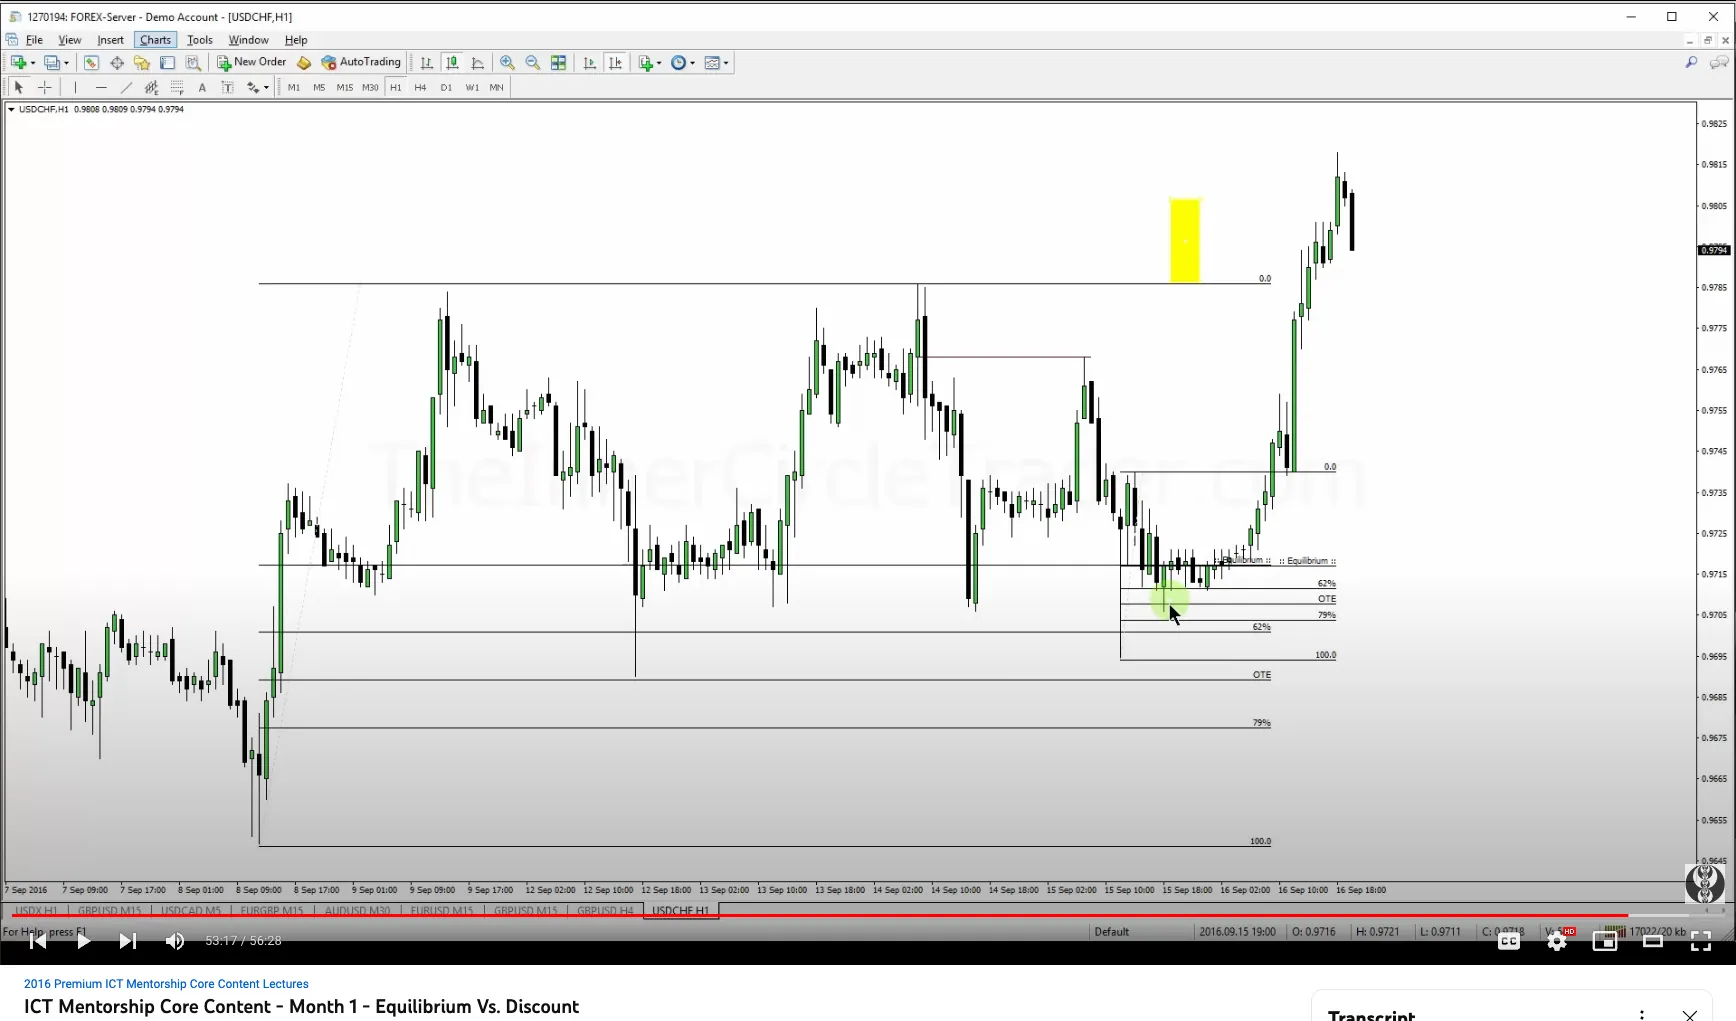
- After price has retraced to the Equilibrium, go to lower timeframes and hunt for buying/selling opportunities
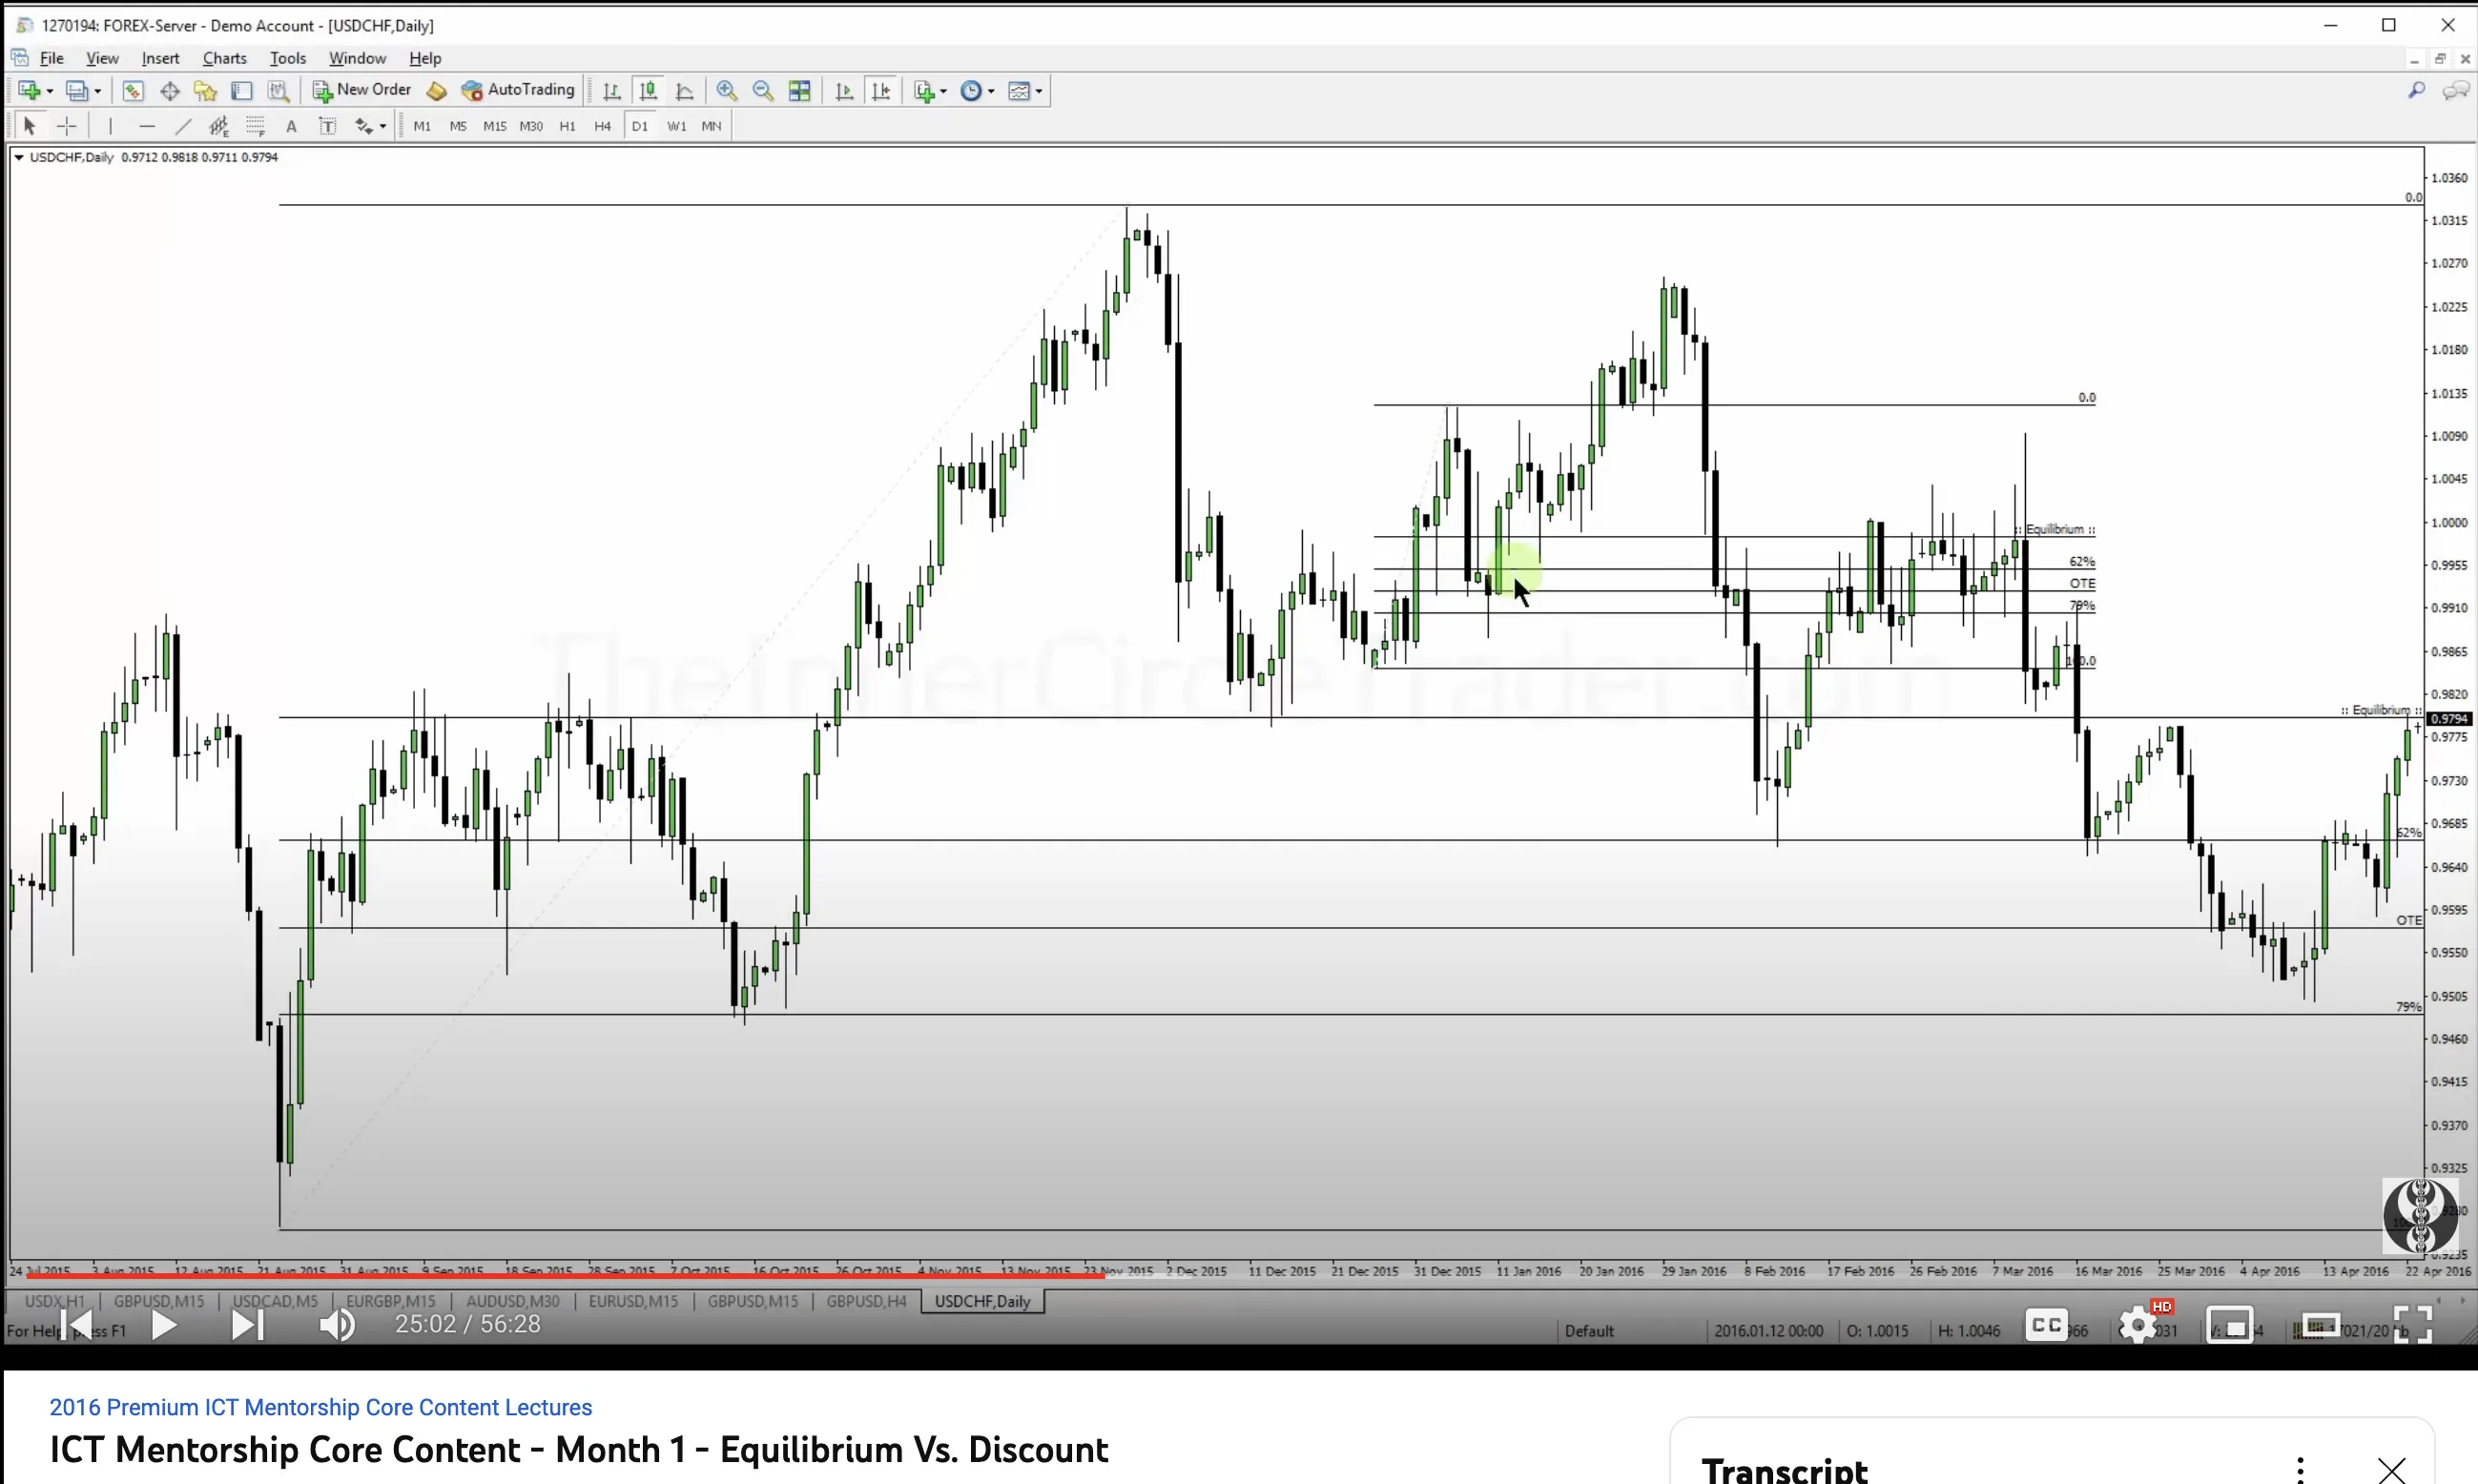
- Nested Premium vs Discount Lines
- After drawing the 50% Fibonacci from a Swing High/Low to Swing Low/High AND price trades back to the Equilibrium
- Can enter trade after price trades to the other side of Equilibrium
- BUT also can nest a second 50% Fibonacci line starting from the swing that broke the Equilibrium (or lowest/highest point afterward) and end at the next swing high/low
- When price trades back to Equilibrium of the 2nd Fibonacci then you can look to enter (additional) trades there
- Can continue to nest Fibonacci drawings and swings until price take out original (1st) Fibs end point or price reverses off of an ICT Orderblock
- Can also use one Fib drawing over multiple swings (thus skipping swings) and look for Equilibrium and OTE setups
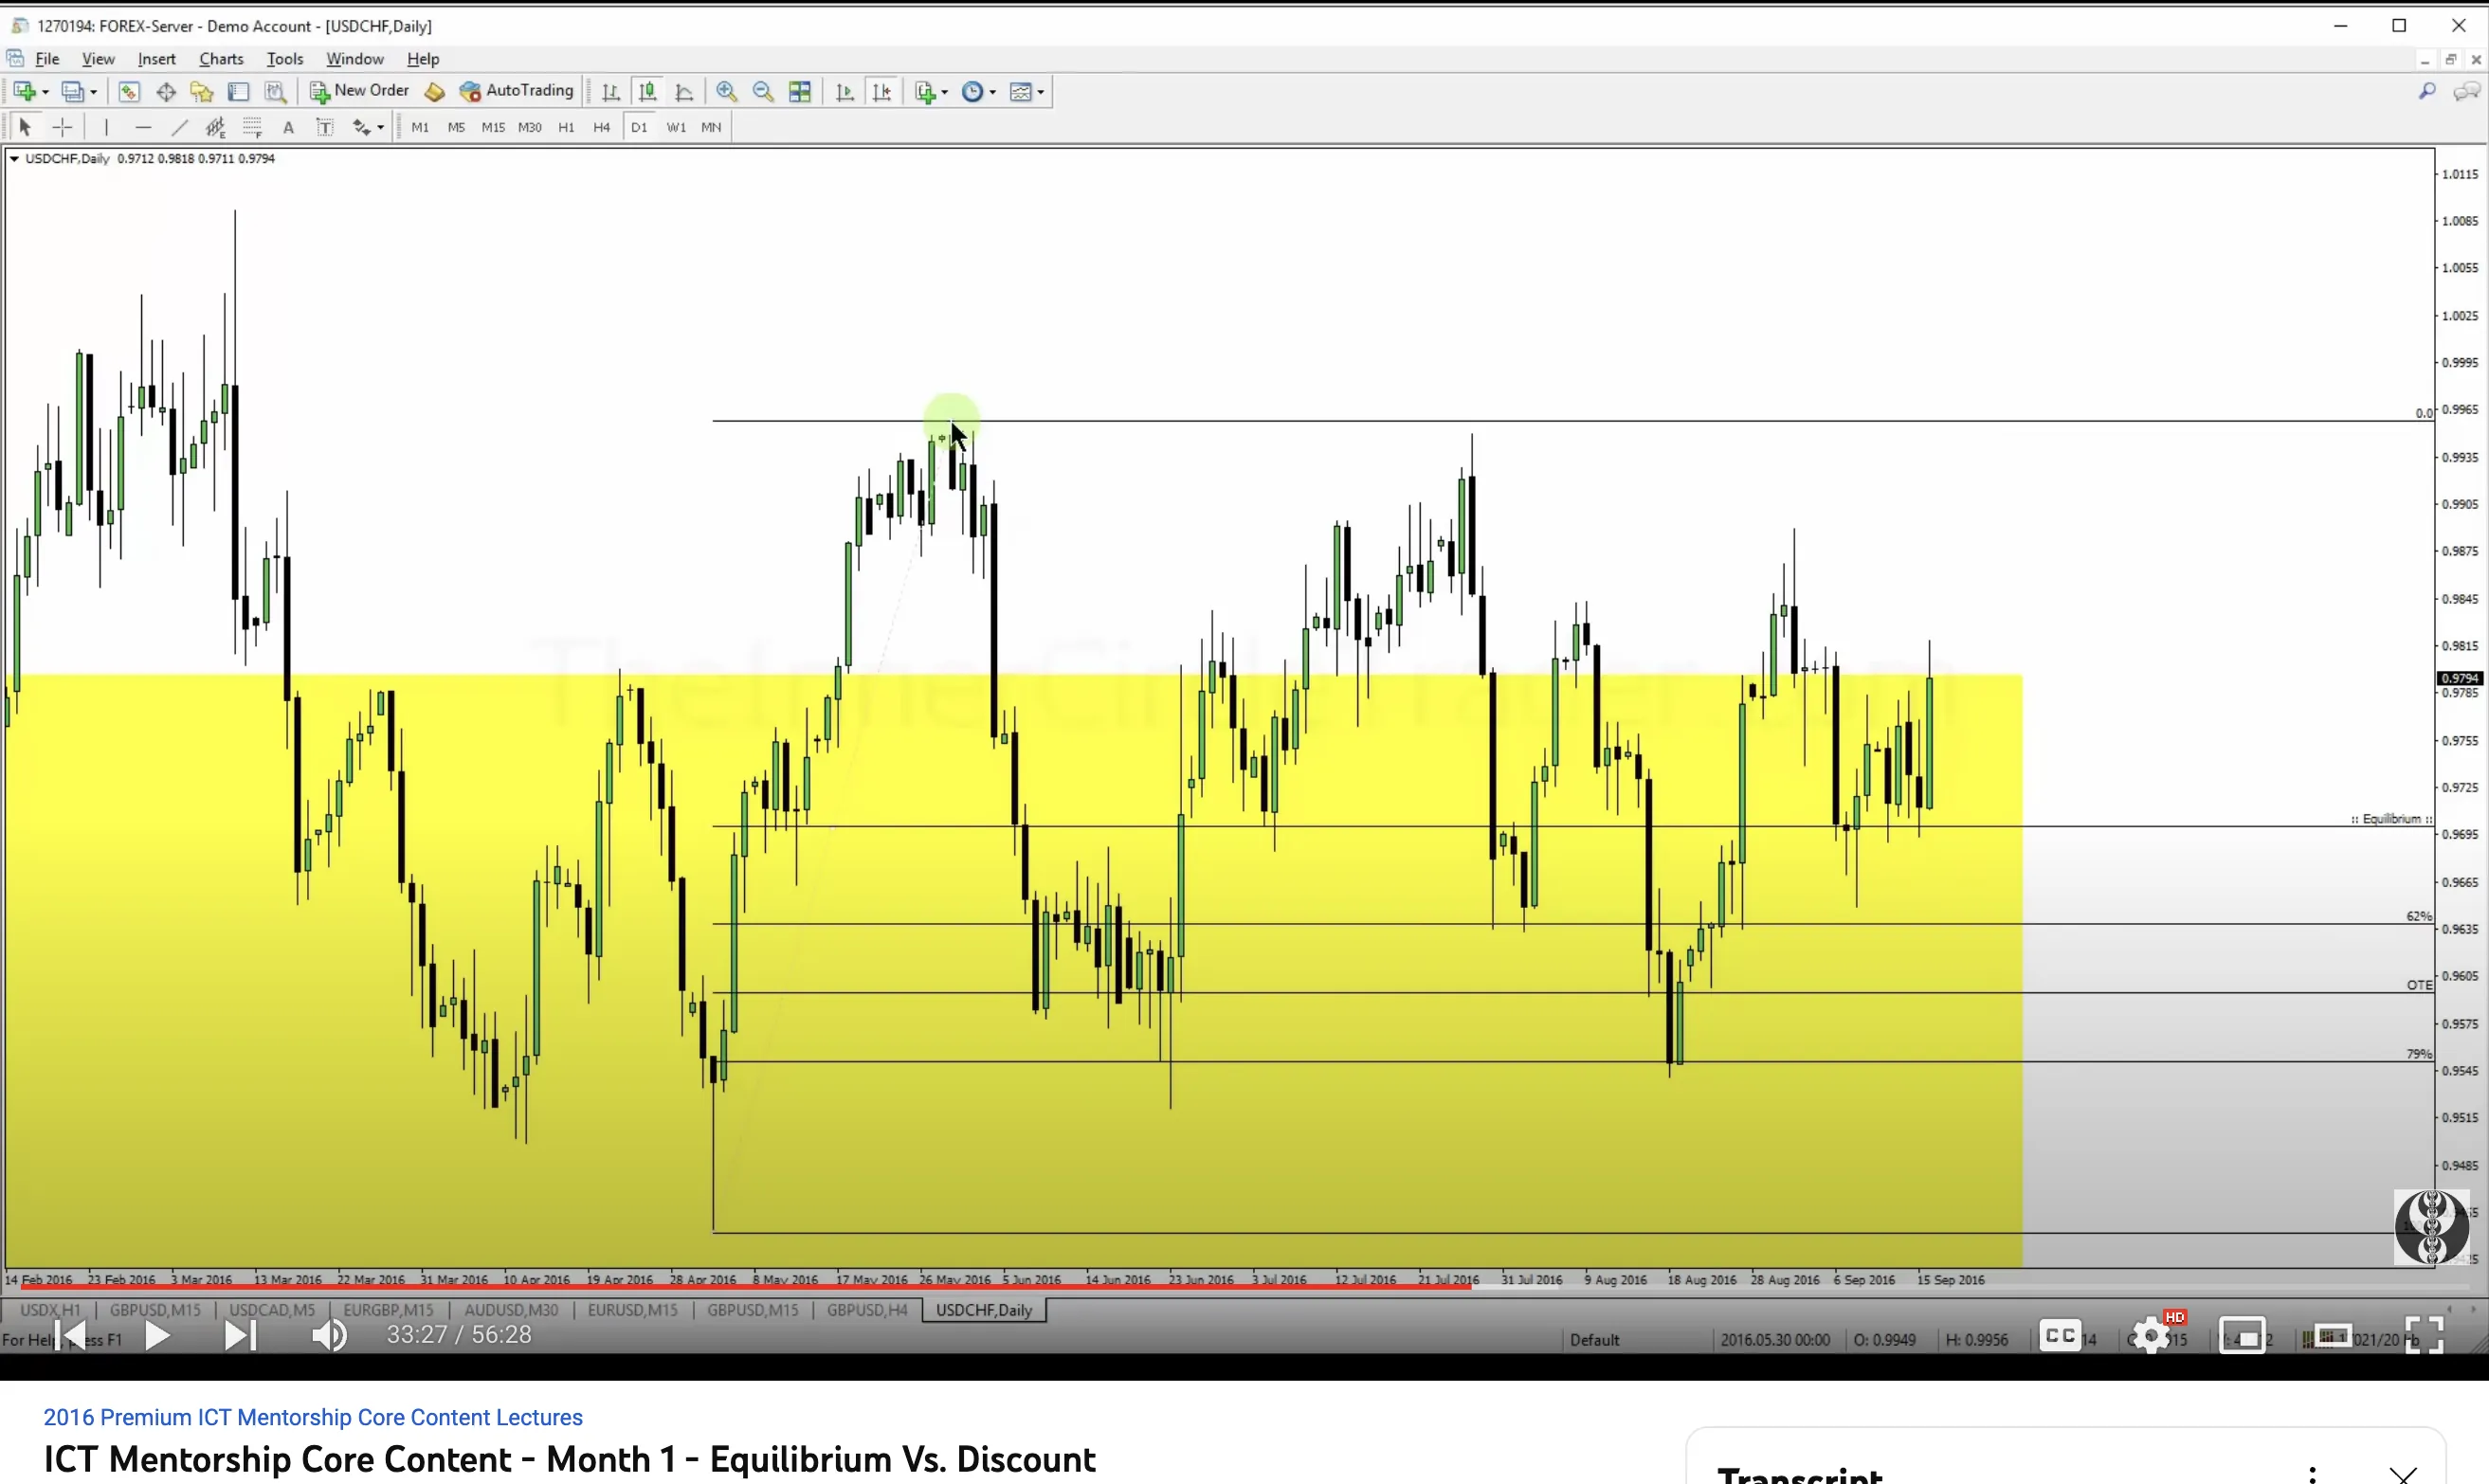
- Anchored Premium vs Discount Line
- Use the 50% Fibonacci Drawing tool to mark Premium to Discount over the largest Market Range (between swing high/low to swing low/high) on your chart
- Leave that Equilibrium line in place as long as price trades within that range
- This line is the macro Equilibrium level. Only buy when price is in this Anchored Discount and only sell when price is in the Anchored Premium sections
- Can continue to draw more 50% Fibonacci lines on other swing highs and lows as long as price is still inside the original Anchored 50% Fib line (looking for high probability setups)
- The Anchored 50% Fibonacci line can itself be nested. As long as more price swing are inside larger price swings
- ICT Orderblocks
- When price goes to a deep retracement of a price swing, can also look for retracements at ICT Orderblocks
- ICT Bullish Orderblock is the last down candle before the bullish move up OR the down candle above your swing low
- ICT Bearish Orderblock is the last up candle before the bearish move down OR the up candle below your swing high
- If there are two or more consecutive down candles use the bodies of both candles
- Miscellaneous Notes
- If the price does not get back to the Equilibrium line then move on to the next swing and redraw the Fibonacci lines
- But always consider smaller swings inside your larger range before extending the first original range to an entirely new swing
- If price blows through the OTE levels then most likely it will be a Turtle Soup setup
- Using Premium vs Discount you don’t need to know daily bias
- Because price is trading inside a range. It does not matter if you are trading in a macro bullish market or bearish market. The Premium vs Discount profile using the 50% level between swing highs and swing lows will always be there
- You don’t need to break out of the range to make money
- If the price does not get back to the Equilibrium line then move on to the next swing and redraw the Fibonacci lines
Gallery