Liquidity Runs
Video 7/8
Core Content Month 1 Liquidity Runs
Liquidity
- Liquidity = is the degree to which a market (or asset) can be quickly bought or sold in the market without affecting the assets price
- Buyside Liquidity = There are buy orders, that we cannot see, resting above old swing highs. Price will eventually trade higher and go above old swing highs and doing so will take liquidity from the overall market
- Sellside Liquidity = There are sell orders, that are invisible, hanging below old swing lows. Price will ultimately trade lower and go below that old swing low and will take liquidity from the market
- Fundamental ICT Truth: there is liquidity above old highs and below old lows
- The algorithm will target (or seek) these levels
- The algorithm cannot see these stop orders (liquidity) but the algorithm knows that stop orders are there because that is a logical place to put them
Liquidity Example
- If a swing high is observed in the Marketplace and price trades lower, then we know that an entity (with a lot of orders) went short at the location of the swing high
- We can logically deduce the following about that person or institution:
- That entity would be profitable as price continues to go lower
- Assuming the entity held its short position when the market turns around and goes higher, its profit would decrease as price increase
- If price continued going higher while still holding and went above the level they first went short, their profit would be negative
- Logically this entity would place their stop loss buy orders just above the swing high where they first went short at
- The algorithm has an interest in going back to the price where that large body of interest first occurred. This is called liquidity
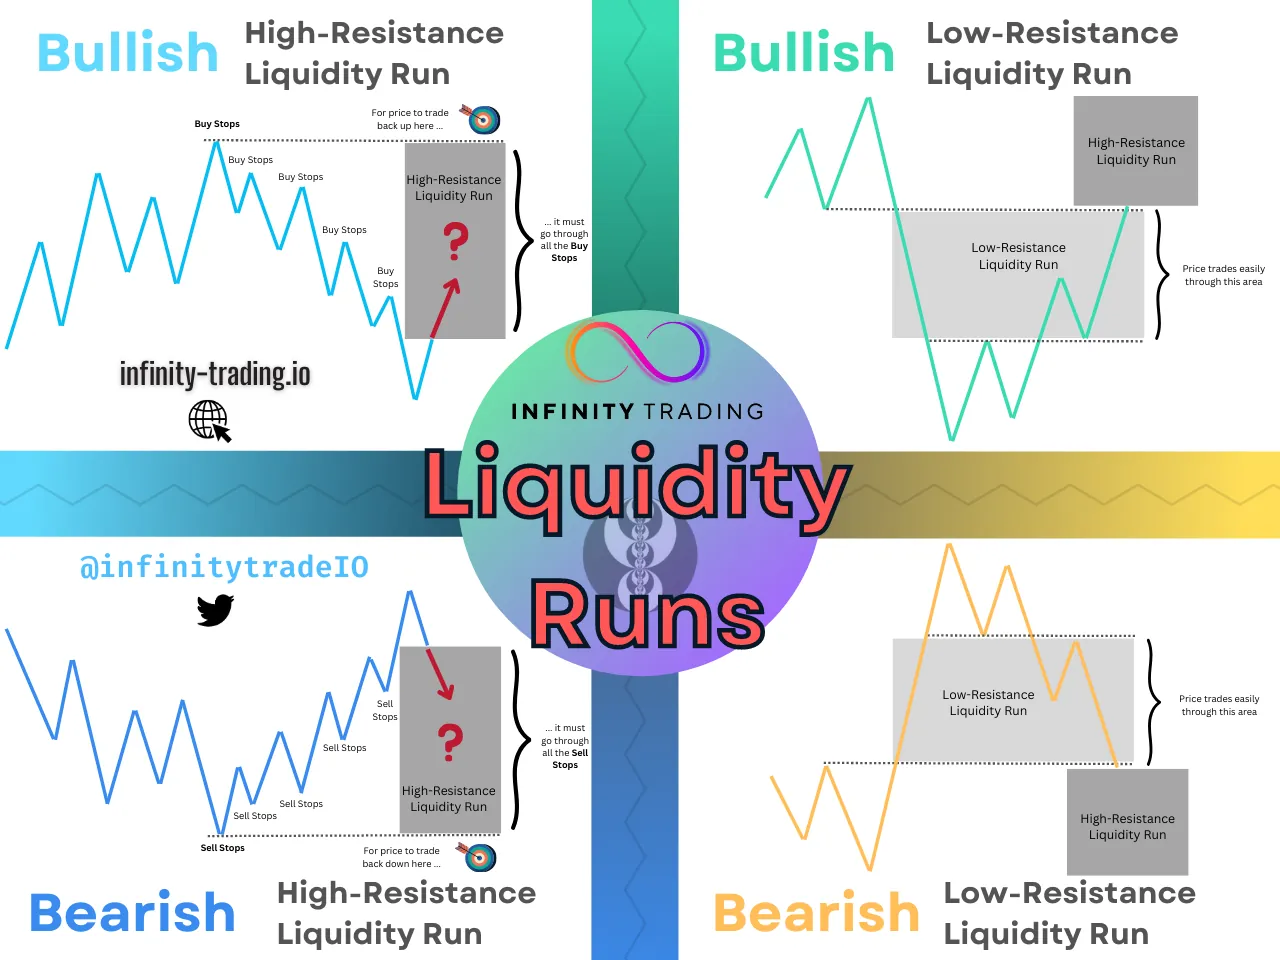
High Resistance Liquidity Runs
- High Resistance Liquidity Run (HRLR) = is when candles are bunched together making slow higher highs or lower lows (no quick price movements)
- With High Resistance Liquidity Runs the Market is going to have a difficult time getting through all the previous highs and lows just to get to its objective which is the highest high or lowest low of a recent range
- When there are many highs and lows (each one is liquidity) close together price is met with high resistance if price wanted to travel back through the range. Why? Because above each swing high and swing low are sell stops and buy stops. These create impediments to progress because they cause price to temporarily go the other direction
- Do not expect price to run quickly through High Resistance areas (unless High an Impact News event)
- High Impact News events can quickly run through the High Resistance Liquidity to get to the highest highs or lowest lows
- Trading in High Resistance Liquidity Run:
- Difficult to trade
- High Resistance areas are low probability trading conditions because there are so many levels of resistance of old highs and old lows for price to encounter before getting back to a significant high or low
- Price action is very chopping in High Resistance areas
- Trade less frequently in HRLR
- Every time the market retraces the retracement is going to be in the form of a High Resistance Liquidity Run
Low Resistance Liquidity Runs
- Low-Resistance Liquidity Run (LRLR) = price runs for an old high or old low very quickly with a sharp angle with very little retracement
- Sharp and one-way price action with very little resistance
- The easiest area to trade because price cuts through this area very quickly
- An Expansion creates a Low-Resistance Liquidity Run
- When price breaks an old low and goes down sharply, the area all the way down until we get a higher high is the Low Resistance Liquidity Run
- When price breaks an old high and goes up sharply, the area all the way up until we get a lower-low is the Low Resistance Liquidity Run
- Trading Low Resistance Liquidity Runs
- Easier to trade
- Setups that form in an LRLR are high-probability setups
- Look for trade setups that go in the direction of filling the Expansion
Bullish & Bearish Trends
- Bullish Trend Price Action
- Every short-term high in an uptrend is going to have easy runs through them (the resistance will be very weak). This is a form of Low-Resistance Liquidity Run
- The swing lows in an uptrend are going to be very strong (High-Resistance Liquidity Run). Meaning it will take incredible effort for price to break through them
- In a bullish environment, a move down is actually just a new low-resistance liquidity run to make a run above an old swing high
- Bearish Trend Price Action
- Every short-term low in a downtrend is going to have easy runs through them (the resistance will be very weak). This is a form of Low-Resistance Liquidity Run
- The swing highs in a downtrend are going to be very strong (High-Resistance Liquidity Run). Meaning it will take incredible effort for price to break through them
- In a bearish environment, a move up is actually just a new low-resistance liquidity run to make a run below an old swing low
Miscellaneous
- In your charts look for Clean Highs or Clean Lows which are Relative Equal Highs or Relative Equal Lows)
- The more price action there is around a specific level (high or low) that is indicating a level is being defended on an institutional price model
- You are going to see very easy trading when you trade away from that defended level
- This will get you in sync with the Institutional Orderflow